Voting behaviour and the media
General elections are influenced by a huge variety of other factors, and it
would be simplistic to argue that the public will always vote according to
class-based allegiance. For example, Theresa May and Boris Johnson won
several traditionally working-class seats in 2017 and 2019, while seats
that had been firmly Conservative were won by Labour. The relationship
between social class and voting behaviour is further complicated by the
reasons why voters of all classes might vote for the Lib Dems, the
nationalist parties and the UKIP/Brexit/Reform parties.
Class Composition and description
A Higher managerial, professional such as judges, doctors
etc, upper middle class
B Middle managers, professionals such as teachers and
lawyers, and middle class
C1 Clerical workers, junior managerial roles, shop owners
and lower middle class
C2 Skilled workers such as builders and the aspirational
working class
D Semi-skilled, unskilled factory workers and the working
class
E Casual workers, long-term unemployed, elderly people
who rely solely on the state pension and the working
class
Social factors
Class-based voting and class/partisan dealignment
From 1945 until 1966. General elections were defined by how successful
the Labour and Conservative parties were in mobilising their core support.
The Conservatives generally relied on the support of A, B and C1 voters,
with Labour’s core support among C2, D and E voters. However, the 2019
election, in which the Conservative leader Boris Johnson achieved a
surprise victory over Jeremy Corbyn, demonstrated that issue voting could
determine the result of a general election as much as class-based voting.
In this election, Conservatives won many traditionally Labour seats
because they promised a Brexit deal following the 2016 referendum.
For example, in the 1979 general election, Margaret Thatcher startled
political commentators by launching the Conservative campaign in
Labour-supporting Cardiff. This was a clear attempt to disassociate the
party from being too middle class. The campaign’s resulting focus on
controlling inflation, enabling tenants to buy their own council houses and
confronting trade union power following the excessive number of strikes
during the so-called ‘Winter of Discontent’, was so popular that there was
, an 11% swing to the Conservative by C2 voters and a 9% swing by DE
voters. Public discontent during the winter of discontent led to significant
class dealignment in the 1979 general election.
Class dealignment – suggests that voters are much less likely to vote
according to their membership of a particular social class. It is closely
linked to partisan dealignment, whereby voters abandon traditional party
loyalties.
Like Thatcher, Tony Blair was highly successful at broadening his party’s
appeal far beyond its core support. He increased Labour’s share of the
vote in all social categories and won a majority of support in all age
groups with the progressive appeal of New Labour.
Region
- The Southeast is the most prosperous region in the UK, with high
levels of home ownership and little tradition of heavy industrial
trade unionism. The Conservatives do disproportionately well there.
Ethically white rural parts of the UK, such as the East Anglia and the
South Coast, are also classic Conservative Territory.
- Labour, meanwhile has dominated ethnically diverse big cities, with
large working class populations, and major centres of industrial
production such as South Wales, Merseyside, Greater Manchester
and Tyne and Wear.
- As a rule, the industrial North of England has been more likely to
vote Labour and the South of England Conservative.
The Lib Dems have fared disproportionality badly out of the UK’s FPTP
electoral system because they have fewer areas of concentrated support.
However, they do have some support in areas where there is a long
tradition of small-scale, non-conformist artisans who do not identify with
either of the main political parties e.g. Orkney and Shetland.
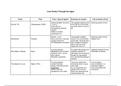
Voting by region
Region 2019 2024
North East Labour – 42.6% Labour – 45.4%
Conservative – 38.3% Conservative – 20.2%
Liberal Democrats – Liberal Democrat – 5.9%
6.8%
North West Labour – 46.5% Labour – 44%
Conservative – 37.5% Conservative – 18.8%
Liberal Democrats – Liberal Democrat -7.8%
7.9%
Yorkshire and Labour – 38.9% Labour – 40.9%
Humber Conservative – 43.1% Conservative – 22.8%
Liberal Democrats – Liberal Democrat – 7.1%
General elections are influenced by a huge variety of other factors, and it
would be simplistic to argue that the public will always vote according to
class-based allegiance. For example, Theresa May and Boris Johnson won
several traditionally working-class seats in 2017 and 2019, while seats
that had been firmly Conservative were won by Labour. The relationship
between social class and voting behaviour is further complicated by the
reasons why voters of all classes might vote for the Lib Dems, the
nationalist parties and the UKIP/Brexit/Reform parties.
Class Composition and description
A Higher managerial, professional such as judges, doctors
etc, upper middle class
B Middle managers, professionals such as teachers and
lawyers, and middle class
C1 Clerical workers, junior managerial roles, shop owners
and lower middle class
C2 Skilled workers such as builders and the aspirational
working class
D Semi-skilled, unskilled factory workers and the working
class
E Casual workers, long-term unemployed, elderly people
who rely solely on the state pension and the working
class
Social factors
Class-based voting and class/partisan dealignment
From 1945 until 1966. General elections were defined by how successful
the Labour and Conservative parties were in mobilising their core support.
The Conservatives generally relied on the support of A, B and C1 voters,
with Labour’s core support among C2, D and E voters. However, the 2019
election, in which the Conservative leader Boris Johnson achieved a
surprise victory over Jeremy Corbyn, demonstrated that issue voting could
determine the result of a general election as much as class-based voting.
In this election, Conservatives won many traditionally Labour seats
because they promised a Brexit deal following the 2016 referendum.
For example, in the 1979 general election, Margaret Thatcher startled
political commentators by launching the Conservative campaign in
Labour-supporting Cardiff. This was a clear attempt to disassociate the
party from being too middle class. The campaign’s resulting focus on
controlling inflation, enabling tenants to buy their own council houses and
confronting trade union power following the excessive number of strikes
during the so-called ‘Winter of Discontent’, was so popular that there was
, an 11% swing to the Conservative by C2 voters and a 9% swing by DE
voters. Public discontent during the winter of discontent led to significant
class dealignment in the 1979 general election.
Class dealignment – suggests that voters are much less likely to vote
according to their membership of a particular social class. It is closely
linked to partisan dealignment, whereby voters abandon traditional party
loyalties.
Like Thatcher, Tony Blair was highly successful at broadening his party’s
appeal far beyond its core support. He increased Labour’s share of the
vote in all social categories and won a majority of support in all age
groups with the progressive appeal of New Labour.
Region
- The Southeast is the most prosperous region in the UK, with high
levels of home ownership and little tradition of heavy industrial
trade unionism. The Conservatives do disproportionately well there.
Ethically white rural parts of the UK, such as the East Anglia and the
South Coast, are also classic Conservative Territory.
- Labour, meanwhile has dominated ethnically diverse big cities, with
large working class populations, and major centres of industrial
production such as South Wales, Merseyside, Greater Manchester
and Tyne and Wear.
- As a rule, the industrial North of England has been more likely to
vote Labour and the South of England Conservative.
The Lib Dems have fared disproportionality badly out of the UK’s FPTP
electoral system because they have fewer areas of concentrated support.
However, they do have some support in areas where there is a long
tradition of small-scale, non-conformist artisans who do not identify with
either of the main political parties e.g. Orkney and Shetland.
Voting by region
Region 2019 2024
North East Labour – 42.6% Labour – 45.4%
Conservative – 38.3% Conservative – 20.2%
Liberal Democrats – Liberal Democrat – 5.9%
6.8%
North West Labour – 46.5% Labour – 44%
Conservative – 37.5% Conservative – 18.8%
Liberal Democrats – Liberal Democrat -7.8%
7.9%
Yorkshire and Labour – 38.9% Labour – 40.9%
Humber Conservative – 43.1% Conservative – 22.8%
Liberal Democrats – Liberal Democrat – 7.1%