Excel IKM Test , IKM Excel assessment,
Excel functions and formulas, data analysis
exam, pivot tables, Excel skills test, verified
Excel answers
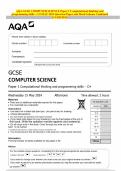
Determine what is the correct name for the areas, highlighted in red in the
image 1?
a) These are the Excel Formula Bar addresses.
b) These are the Excel column and row labels.
c) These are the Excel Ribbon function groups.
d) These are Excel Grid headers.
e) All the above options are incorrect. - ANSWER>>b
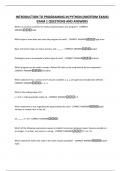
What is the correct name of the area outlined in yellow in the image 2?
a) Excel formula Bar
b) Excel Cell Address Bar
c) Excel Address Bar
d) Excel Column and Row Address
e) Excel Name Box - ANSWER>>e
What is the difference between Microsoft Excel 2019 (Office 365) and Excel
Online - ANSWER>>Microsoft Excel 2019 is an electronic spreadsheet
program installed on your computer. When
you buy Excel 2019 you pay one time fee and you own the software.
Excel 365 comes as part of Office 365 subscription.
,What are the key components of Excel User Interface? - ANSWER>>Excel
uses Ribbon User Interface. It consist of Ribbon Tabs, Groups and Quick
Access Toolbar
What are Excel Tables and when you might consider using them? -
ANSWER>>Excel tables have been designed to make managing and
analyzing a group of related data easier.
What is Excel Range. And how is Excel Range different from Excel Tables? -
ANSWER>>Excel Range is a group or block of cell references that are
entered to perform calculations or as an
argument for a function.
Excel Table is a defined grid of cells for data and formulas that
automatically expands as you add to it
and also automatically has the capacity to sort and filter.
What is VLOOKUP formula Syntax and Typical Usage? -
ANSWER>>VLOOKUP function finds items in a table or range by row.
VLOOKUP is designed to retrieve data from a
specific column in table.
What is XLOOKUP formula? - ANSWER>>XLOOKUP function performs
lookups in vertical or horizontal ranges. It is a more robust and flexible
successor than traditional VLOOKUP
What are the tools available to analyze Transactional Data in Excel? -
ANSWER>>Transactions could be analyzed manually in Excel Ranges. Excel
, PowerQuery is designed to import and process transactional data, Excel
Tables are designed to
store and Excel Pivot Tables and Pivot Charts are designed to analyze and
report on transactional data.
What is Excel PowerQuery and how you can use it? - ANSWER>>is the
technology that enables business users to access data stored in various
sources and allows to import and transform the data without writing code.
Ribbon - > Data->"Get & Transform" section.
If you know that particular functionality exists in Excel but you are not sure
on which Ribbon tab it is available how can you use it quickly? -
ANSWER>>You can use search functionlity on Excel Ribbon.
What is a Pivot Table and when should you use them in Excel? -
ANSWER>>A pivot table is a data summarization tool that is used to
analyze and report the data. Pivot tables are used to summarize, sort,
reorganize, group, count, total or average data stored in a database.
What is Excel Pivot Chart and when should you use it? - ANSWER>>A Pivot
Chart is a graphical representation of the data from Pivot Table. A Pivot
Chart is especially useful for user when you are trying to analyze and
display results from large dataset.
What is Excel Dashboard and when should you consider using it? -
ANSWER>>An Excel dashboard is designed to help business leaders in
tracking Key Performance Indicators and metrics to enable data driven
decision making based on the data presented in dashboard.
Excel functions and formulas, data analysis
exam, pivot tables, Excel skills test, verified
Excel answers
Determine what is the correct name for the areas, highlighted in red in the
image 1?
a) These are the Excel Formula Bar addresses.
b) These are the Excel column and row labels.
c) These are the Excel Ribbon function groups.
d) These are Excel Grid headers.
e) All the above options are incorrect. - ANSWER>>b
What is the correct name of the area outlined in yellow in the image 2?
a) Excel formula Bar
b) Excel Cell Address Bar
c) Excel Address Bar
d) Excel Column and Row Address
e) Excel Name Box - ANSWER>>e
What is the difference between Microsoft Excel 2019 (Office 365) and Excel
Online - ANSWER>>Microsoft Excel 2019 is an electronic spreadsheet
program installed on your computer. When
you buy Excel 2019 you pay one time fee and you own the software.
Excel 365 comes as part of Office 365 subscription.
,What are the key components of Excel User Interface? - ANSWER>>Excel
uses Ribbon User Interface. It consist of Ribbon Tabs, Groups and Quick
Access Toolbar
What are Excel Tables and when you might consider using them? -
ANSWER>>Excel tables have been designed to make managing and
analyzing a group of related data easier.
What is Excel Range. And how is Excel Range different from Excel Tables? -
ANSWER>>Excel Range is a group or block of cell references that are
entered to perform calculations or as an
argument for a function.
Excel Table is a defined grid of cells for data and formulas that
automatically expands as you add to it
and also automatically has the capacity to sort and filter.
What is VLOOKUP formula Syntax and Typical Usage? -
ANSWER>>VLOOKUP function finds items in a table or range by row.
VLOOKUP is designed to retrieve data from a
specific column in table.
What is XLOOKUP formula? - ANSWER>>XLOOKUP function performs
lookups in vertical or horizontal ranges. It is a more robust and flexible
successor than traditional VLOOKUP
What are the tools available to analyze Transactional Data in Excel? -
ANSWER>>Transactions could be analyzed manually in Excel Ranges. Excel
, PowerQuery is designed to import and process transactional data, Excel
Tables are designed to
store and Excel Pivot Tables and Pivot Charts are designed to analyze and
report on transactional data.
What is Excel PowerQuery and how you can use it? - ANSWER>>is the
technology that enables business users to access data stored in various
sources and allows to import and transform the data without writing code.
Ribbon - > Data->"Get & Transform" section.
If you know that particular functionality exists in Excel but you are not sure
on which Ribbon tab it is available how can you use it quickly? -
ANSWER>>You can use search functionlity on Excel Ribbon.
What is a Pivot Table and when should you use them in Excel? -
ANSWER>>A pivot table is a data summarization tool that is used to
analyze and report the data. Pivot tables are used to summarize, sort,
reorganize, group, count, total or average data stored in a database.
What is Excel Pivot Chart and when should you use it? - ANSWER>>A Pivot
Chart is a graphical representation of the data from Pivot Table. A Pivot
Chart is especially useful for user when you are trying to analyze and
display results from large dataset.
What is Excel Dashboard and when should you consider using it? -
ANSWER>>An Excel dashboard is designed to help business leaders in
tracking Key Performance Indicators and metrics to enable data driven
decision making based on the data presented in dashboard.