MATH 225N Week 8 Assignment: Predictions Using Linear Regression,Verified Answers.
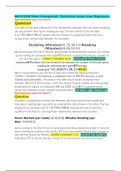
MATH 225N Week 8 Assignment: Predictions Using Linear Regression Question The table shows data collected on the relationship between the time spent studying per day and the time spent reading per day. The line of best fit for the data is yˆ=0.16x 36.2. Assume the line of best fit is significant and there is a strong linear relationship between the variables. Studying (Minutes) 50,70,90,110 Reading (Minutes) 44,48,50,54 Question Michelle is studying the relationship between the hours worked (per week) and time spent reading (per day) and has collected the data shown in the table. The line of best fit for the data is yˆ=−0.79x 98.8. Assume the line of best fit is significant and there is a strong linear relationship between the variables. Hours Worked (per week) 30,40,50,60 Minutes Reading (per day) 75,68,58,52
Written for
- Institution
- Chamberlain College Of Nursing
- Module
- MATH 225N Statistical Reasoning For The Health Sciences (MATH225N)
Document information
- Uploaded on
- June 22, 2020
- Number of pages
- 2
- Written in
- 2019/2020
- Type
- Study guide
Subjects
-
math 225n week 8 assignment predictions using linear regression
-
math225n week 8 assignment predictions using linear regression
-
the table shows data collected on the relationship between the time spe
Also available in package deal