§2
Data variables: different types of data
- Response (dependent): what is under observation - y-axis
- Explanatory (independent): what is under control - x-axis
Types of data:
- Numeric data:
- Continuous: infinitely spread over range of values - e.g. time, length, area
- Discrete: whole number values - e.g. number of individuals, count of occurence
- Categorical data:
- Ordinal: categories with an ordered relation - e.g. small medium large
- Nominal: categories without ordered relation - e.g. color, species
- Binominal: categories with two possibilities - e.g. yes/no
Organizing data: how to construct a frame
- data frame: data for each variable in its own column
- number of rows = number of observations (n)
Descriptive statistics: what does our data look like?
→ graphs, boxplots, histograms, etc.
→ summary calculations: median, mean/average, standard deviation
Inferential statistics: what can we infer from that?
→ how does sample relate to generalize findings and vice-versa?
, → are any differences coincidence?
→ how can past and current data help to project future outcomes?
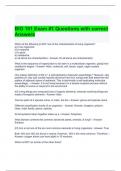
1. Mode = most often recorded value
2. Median = middle value
3. Mean = average value
→ normal distribution: mode = mean = median
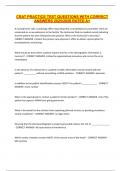
Central limit theory: large enough sample sizes will generally present a ‘normal’ spread from center value
- data is often not ‘normal’
- first step: check how ‘normally’ spread data is
1. Right-skew: mode < median < mean
2. Left-skew: mean < median < mode
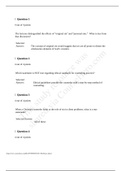
Calculating:
Mean = average =
Median = M
- middle number
- if n is an odd number:
, - if n is an even number:
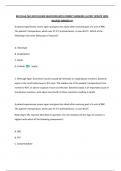
Dispersion: deviation from the mean
- Deviation: by how much a datapoint differs from the mean
Sample deviation: dispersion from the mean
1. Sum of squared deviations (sum of squares) - measures total variability
- squaring deviations eliminates cancelling of values
-
2. Degrees of freedom
- based on sample size (n)
-
3. Variance within sample
- measures spread over a dataset
-
Data variables: different types of data
- Response (dependent): what is under observation - y-axis
- Explanatory (independent): what is under control - x-axis
Types of data:
- Numeric data:
- Continuous: infinitely spread over range of values - e.g. time, length, area
- Discrete: whole number values - e.g. number of individuals, count of occurence
- Categorical data:
- Ordinal: categories with an ordered relation - e.g. small medium large
- Nominal: categories without ordered relation - e.g. color, species
- Binominal: categories with two possibilities - e.g. yes/no
Organizing data: how to construct a frame
- data frame: data for each variable in its own column
- number of rows = number of observations (n)
Descriptive statistics: what does our data look like?
→ graphs, boxplots, histograms, etc.
→ summary calculations: median, mean/average, standard deviation
Inferential statistics: what can we infer from that?
→ how does sample relate to generalize findings and vice-versa?
, → are any differences coincidence?
→ how can past and current data help to project future outcomes?
1. Mode = most often recorded value
2. Median = middle value
3. Mean = average value
→ normal distribution: mode = mean = median
Central limit theory: large enough sample sizes will generally present a ‘normal’ spread from center value
- data is often not ‘normal’
- first step: check how ‘normally’ spread data is
1. Right-skew: mode < median < mean
2. Left-skew: mean < median < mode
Calculating:
Mean = average =
Median = M
- middle number
- if n is an odd number:
, - if n is an even number:
Dispersion: deviation from the mean
- Deviation: by how much a datapoint differs from the mean
Sample deviation: dispersion from the mean
1. Sum of squared deviations (sum of squares) - measures total variability
- squaring deviations eliminates cancelling of values
-
2. Degrees of freedom
- based on sample size (n)
-
3. Variance within sample
- measures spread over a dataset
-