Management Accounting Samenvatting
Alle relevante hoofdstukken uit het boek (Management & cost accounting) zijn in deze
samenvatting opgenomen
Alle colleges (1-13) zijn hierin opgenomen, maar sommige hebben geen apart hoofdstuk
maar zijn verwerkt in de hoofdstukken van het boek om het overzichtelijk te houden
Ik verkoop ook een Excel-sheet met de belangrijkste formules!
Symbool Betekenis
USP Unit selling price
UVC Unit variable cost
UCM Unit contribution margin (USP – UVC)
FC Fixed cost
Q Quantity of output units sold (or manufactured)
or order quantity
OP Operating profit
TOP Target operating profit
FG Finished goods
WIP Work In Progress
D Demand per period
C Carrying cost per period per unit
P Fixed costs when ordering products
Formules Betekenis
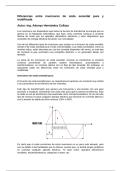
Highest DP−Lowest DP (¿ Die hoort bij de IV )P High low methode om de helling van
Highest IV −Lowest IV Q een kostenregressie te maken
USP -/- UVC Contributiemarge
Revenues -/- Cost of goods sold Gross margin
Total contribution margin Contribution margin percentage
revenues
Total variable costs Variable-cost percentage
Revenues
Grossmargin Gross margin percentage
Revenues
Net income Net profit margin
Total revenue
(Change in operating profit) – (Contribution margin) Change in unit sales level
Additional incremental or outlay cost per unit incurred up Minimum transfer price
to the point of transfer + Opportunity costs per unit to the
supplying division
Target operating profit / Full product cost Mark-up percentage
Profits / Investment ROI (Return on Investment)
Income / revenues ROS (Return on sales)
Revenues DUPONT-method
∗Income
Investment
Revenues
Income -/- (Required rate of return * Investment) Residual income
After-tax operating profit -/- [Weighted-average cost of Economic Value Added (EVA)
1
,capital * (Total assets -/- Current liabilities)]
Debt Equity Weighted-average cost of capital
∗rD∗( 1−tax rate )+ ∗ℜ
Debt + Equity Debt + Equity (WACC)
Cost of goods sold / average inventory Inventory turnover ratio
Number of units sold per unit of time * Purchase-order Reorder point
lead time
2 DP Optimal order quantity (Formule van
Q=
√ C
FC +OP
Camp)
Break even point with a certain
(USP−UVC ) amount of profits
¿ cost−(¿ man. per unit∗( Production−Q ) ) Break even point under absorption
Unit contribution margin costing
Budgeted ¿ overhead costs ¿ Allocation rate
Quantity of allocation base (¿ Denominator)
(Absorption-costing operation profit) – Variable- 3 different ways to calculate the
costing operation profit) = (Fixed manufacturing costs difference in operation profit
in closing stock) – Fixed manufacturing costs in between the absorption and variable
opening stock) costing methods
(Absorption-costing operation income) – (Variable-
costing operation income) = ((Units produced) – (Units
sold)) * (Budget fixed manufacturing costs rate)
(Absorption-costing operation income) – (Variable-
costing operation income) = ((Closing stock in units) –
(Opening stock in units)) * (Budget fixed
manufacturing cost rate)
Direct variances
Actual results -/- Budgeted results Static budget variance (The total
amount of budgets)
Actual results -/- Flexible budget (Only the output are Flexible budget variance
actual units)
(Actual price of input – budgeted price of input) * Actual Price variance
quantity of input.
(Actual quantity of input used – Budgeted quantity of input Efficiency variance
allowed for actual output) * Budgeted price of input
(Actual total quantity of all direct materials inputs used Yield variance
-/- Budgeted total quantity of all direct materials inputs
allowed for actual output achieved) * Budgeted direct
materials input mix percentage * Budgeted price of direct
materials input.
(Actual direct materials input mix percentage -/- Budgeted Mix variance
direct materials input mix percentage) * Actual total
quantity of all direct materials inputs used * Budgeted
price of direct materials input
(Actual sales quantity in units -/- Budgeted sales quantity Sales volume variance
in units) * Budgeted contribution margin
(Actual units of all products sold -/- Budgeted units of all Sales quantity variances
products sold) * Budgeted sales mix percentage *
Budgeted selling price per unit
Actual units of all products sold * (Actual sales-mix Sales-mix variance
percentage -/- Budgeted sales-mix percentage) * Budgeted
2
, selling price per unit
(Actual market size in units -/- Budgeted market size in Market-size variance
units) * Budgeted market share * Budgeted average price
per unit
Actual market size in units (Actual market share -/- Market-share variance
Budgeted market share) * Budgeted average price per unit
Overhead variances
Actual fixed overhead cost -/- Budgeted fixed overhead Flexible budget variance (Fixed
costs overhead) or Spending variance
Actual variable overhead cost -/- Budgeted input allowed Flexible budged variance (Variable
for actual ouput * Budgeted rate (Flexible budget) overhead)
Actual units of variable overhead cost-allocation base used Efficiency variance (Variable
for actual output -/- Budgeted units of variable overhead overhead
cost-allocation base allowed for actual output) * Budgeted
variable overhead rate
(Actual variable overhead cost per unit of cost-allocation Spending variance (Variable
base -/- Budgeted variable overhead cost per unit of cost- overhead)
allocation base) * Actual quantity of variable overhead
cost-allocation base used for actual ouput
Les 1 27-1 (1, 19, 20)
Management accounting: Measures and reports fin. and non fin,. information (Ethiek) and helps and
motivates managers to make good decisions to fulfil an organization’s goals. Belangrijk om de link
tussen strategie en financiele controle te versterken. Twee activiteiten:
Decision facilitating: Helpt om makkelijker beslissingen te nemen
Decision influencing: Zorgt ervoor dat zowel de agent als de principaal hetzelfde doel voor
ogen hebben (Bijvoorbeeld met bonussen). Geeft oplossing voor het moral hazard probleem
bij de principaal en voorkomt adverse selection bij de agent. Deelgebieden:
o Motivating employees (Incentives)
o Coordinating among departments (Functional budgeting)
o Controlling performance (Management audit etc.)
Cost accounting: Measures and reports financial and non-financial data that relates to the cost
acquiring or consuming resources by an organization
Balanced Scorecard: De strategie van een onderneming in cijfers. Perspectieven: Learning and
growth, customers, internal processes and financial.
3
Alle relevante hoofdstukken uit het boek (Management & cost accounting) zijn in deze
samenvatting opgenomen
Alle colleges (1-13) zijn hierin opgenomen, maar sommige hebben geen apart hoofdstuk
maar zijn verwerkt in de hoofdstukken van het boek om het overzichtelijk te houden
Ik verkoop ook een Excel-sheet met de belangrijkste formules!
Symbool Betekenis
USP Unit selling price
UVC Unit variable cost
UCM Unit contribution margin (USP – UVC)
FC Fixed cost
Q Quantity of output units sold (or manufactured)
or order quantity
OP Operating profit
TOP Target operating profit
FG Finished goods
WIP Work In Progress
D Demand per period
C Carrying cost per period per unit
P Fixed costs when ordering products
Formules Betekenis
Highest DP−Lowest DP (¿ Die hoort bij de IV )P High low methode om de helling van
Highest IV −Lowest IV Q een kostenregressie te maken
USP -/- UVC Contributiemarge
Revenues -/- Cost of goods sold Gross margin
Total contribution margin Contribution margin percentage
revenues
Total variable costs Variable-cost percentage
Revenues
Grossmargin Gross margin percentage
Revenues
Net income Net profit margin
Total revenue
(Change in operating profit) – (Contribution margin) Change in unit sales level
Additional incremental or outlay cost per unit incurred up Minimum transfer price
to the point of transfer + Opportunity costs per unit to the
supplying division
Target operating profit / Full product cost Mark-up percentage
Profits / Investment ROI (Return on Investment)
Income / revenues ROS (Return on sales)
Revenues DUPONT-method
∗Income
Investment
Revenues
Income -/- (Required rate of return * Investment) Residual income
After-tax operating profit -/- [Weighted-average cost of Economic Value Added (EVA)
1
,capital * (Total assets -/- Current liabilities)]
Debt Equity Weighted-average cost of capital
∗rD∗( 1−tax rate )+ ∗ℜ
Debt + Equity Debt + Equity (WACC)
Cost of goods sold / average inventory Inventory turnover ratio
Number of units sold per unit of time * Purchase-order Reorder point
lead time
2 DP Optimal order quantity (Formule van
Q=
√ C
FC +OP
Camp)
Break even point with a certain
(USP−UVC ) amount of profits
¿ cost−(¿ man. per unit∗( Production−Q ) ) Break even point under absorption
Unit contribution margin costing
Budgeted ¿ overhead costs ¿ Allocation rate
Quantity of allocation base (¿ Denominator)
(Absorption-costing operation profit) – Variable- 3 different ways to calculate the
costing operation profit) = (Fixed manufacturing costs difference in operation profit
in closing stock) – Fixed manufacturing costs in between the absorption and variable
opening stock) costing methods
(Absorption-costing operation income) – (Variable-
costing operation income) = ((Units produced) – (Units
sold)) * (Budget fixed manufacturing costs rate)
(Absorption-costing operation income) – (Variable-
costing operation income) = ((Closing stock in units) –
(Opening stock in units)) * (Budget fixed
manufacturing cost rate)
Direct variances
Actual results -/- Budgeted results Static budget variance (The total
amount of budgets)
Actual results -/- Flexible budget (Only the output are Flexible budget variance
actual units)
(Actual price of input – budgeted price of input) * Actual Price variance
quantity of input.
(Actual quantity of input used – Budgeted quantity of input Efficiency variance
allowed for actual output) * Budgeted price of input
(Actual total quantity of all direct materials inputs used Yield variance
-/- Budgeted total quantity of all direct materials inputs
allowed for actual output achieved) * Budgeted direct
materials input mix percentage * Budgeted price of direct
materials input.
(Actual direct materials input mix percentage -/- Budgeted Mix variance
direct materials input mix percentage) * Actual total
quantity of all direct materials inputs used * Budgeted
price of direct materials input
(Actual sales quantity in units -/- Budgeted sales quantity Sales volume variance
in units) * Budgeted contribution margin
(Actual units of all products sold -/- Budgeted units of all Sales quantity variances
products sold) * Budgeted sales mix percentage *
Budgeted selling price per unit
Actual units of all products sold * (Actual sales-mix Sales-mix variance
percentage -/- Budgeted sales-mix percentage) * Budgeted
2
, selling price per unit
(Actual market size in units -/- Budgeted market size in Market-size variance
units) * Budgeted market share * Budgeted average price
per unit
Actual market size in units (Actual market share -/- Market-share variance
Budgeted market share) * Budgeted average price per unit
Overhead variances
Actual fixed overhead cost -/- Budgeted fixed overhead Flexible budget variance (Fixed
costs overhead) or Spending variance
Actual variable overhead cost -/- Budgeted input allowed Flexible budged variance (Variable
for actual ouput * Budgeted rate (Flexible budget) overhead)
Actual units of variable overhead cost-allocation base used Efficiency variance (Variable
for actual output -/- Budgeted units of variable overhead overhead
cost-allocation base allowed for actual output) * Budgeted
variable overhead rate
(Actual variable overhead cost per unit of cost-allocation Spending variance (Variable
base -/- Budgeted variable overhead cost per unit of cost- overhead)
allocation base) * Actual quantity of variable overhead
cost-allocation base used for actual ouput
Les 1 27-1 (1, 19, 20)
Management accounting: Measures and reports fin. and non fin,. information (Ethiek) and helps and
motivates managers to make good decisions to fulfil an organization’s goals. Belangrijk om de link
tussen strategie en financiele controle te versterken. Twee activiteiten:
Decision facilitating: Helpt om makkelijker beslissingen te nemen
Decision influencing: Zorgt ervoor dat zowel de agent als de principaal hetzelfde doel voor
ogen hebben (Bijvoorbeeld met bonussen). Geeft oplossing voor het moral hazard probleem
bij de principaal en voorkomt adverse selection bij de agent. Deelgebieden:
o Motivating employees (Incentives)
o Coordinating among departments (Functional budgeting)
o Controlling performance (Management audit etc.)
Cost accounting: Measures and reports financial and non-financial data that relates to the cost
acquiring or consuming resources by an organization
Balanced Scorecard: De strategie van een onderneming in cijfers. Perspectieven: Learning and
growth, customers, internal processes and financial.
3