Midterm
Inhoud
Midterm.................................................................................................................................................1
SPSS....................................................................................................................................................4
Tabellen (SPSS)...............................................................................................................................4
Formules (SPSS)..............................................................................................................................6
Herhaling............................................................................................................................................6
Les 1 27-8 (Hoofdstuk 5).....................................................................................................................6
Les 2 2-9 (Hoofdstuk 19).....................................................................................................................7
Les 3 9-9 (Hoofdstuk 19).....................................................................................................................8
Les 4 11-9 (Hoofdstuk 19)...................................................................................................................9
Les 5 16-9 (19.6-19.8, 20.1, 20.2, 20.5)...............................................................................................9
Les 6 18-9..........................................................................................................................................11
Les 7 23-9 (20.3, 20.4, 20.6, 20,7, 21.1)............................................................................................12
Les 8 25-9..........................................................................................................................................14
Tutorial 26-9.....................................................................................................................................14
Les 9 30-9 (21.2-21.5).......................................................................................................................14
Les 10 2-10........................................................................................................................................14
Eindtoets..............................................................................................................................................16
SPSS..................................................................................................................................................16
Tabellen (SPSS).............................................................................................................................16
Formules (SPSS)............................................................................................................................19
Les 11 7-10 (22.1-22.4).....................................................................................................................19
Non-lineairiteit detecteren...........................................................................................................20
Hetroskedasticiteit detecteren.....................................................................................................20
Niet-normaliteit............................................................................................................................21
Dependence of the error terms ε.................................................................................................21
Les 12 21-10......................................................................................................................................22
Les 13 23-10 (21.6)...........................................................................................................................22
Tutorial 31-10...................................................................................................................................23
Les 14 28-10 (24)..............................................................................................................................23
Les 15 30-10 (24)..............................................................................................................................26
Les 16 4-11 (23)................................................................................................................................26
Les 17 6-11 (23)................................................................................................................................27
1
, Tutorial 14-11...................................................................................................................................28
Les 18 11-11 (22.5)...........................................................................................................................28
Les 19 13-11 (22.5)...........................................................................................................................28
Les 20 18-11......................................................................................................................................29
Les 21 20-11......................................................................................................................................30
Tutorial 28-11...................................................................................................................................30
Tips examen......................................................................................................................................30
Tekens
α De kans dat je H0 verwerpt, terwijl het toch niet verworpen kon worden
y Dependent variable
x Independent variable
e Error. The space between the result and the expected value
b0 Constant value. Gebruik deze als de data bekend is
^y Prediction of y (sample regression line)
B0 Constant of the regression line in a sample. Gebruik deze in de formules (er is onzekerheid)
B1 Variable of the regression line in a sample
β0 Constant of the regression line in a population
β1 Variable of the regression line in a population
C The realization of x. {X1 = x1;…; Xn = xn}
s Sample variance of the unrealized x
S Sample variance of the realized x. X1 = x1
x Unrealized value of x, by example in the Expectation E(x)
X Realized value of x, by example in the model Y=Kx
2
r Coefficient of determination
R2 Realized variable r2
radj2 Coefficient of determination, but with an adjustment to have a more realistic indication
k number of variables X (independent variables)
k+1 number of variables X including the constant
yp Point estimator
SSEr Sum of Squared Errors van het gereduceerde model (k-g)
SSEc Sum of Squared Errors van het complete model (k)
g Aantal beta’s in het gereduceerde model
2
Sε Sample variance
Sε Standard error
Formules
(SSEr −SSE c )/(k−g) F-waarde. Invullen geeft de val
F=
SSEc /(n−( k+ 1 ))
R 2 /k
F=
( 1−R2 ) /¿ ¿
k-g Verschil in variabelen tussen het complete model en het
gereduceerde model
SSE Adjusted coefficient of determination
∗n−1
r 2
adj = 1 - SST
n−(k +1)
2
, SSR SSE (Ordinary) coefficient of determination
r 2= =1− = ( r x , y )2
SST SST
B1 −β1 T-waarde van B1. Invullen geeft de val
T=
SB1
B1−β 1 Z-waarde van B1 met een bekende
Z= σε
2
√ ( n−1 ) s x
n
2 1 SSE 2 Sample variance with 1 variable
s=
ε ∑ ( y −^
y) = i i
n−2 i=1 n−2
SSE Sample variance with k variables
Sε2 =
n−( k +1 )
sε Standard deviation b1
sb1 = 2
( n−1 ) s x
sx , y Regression parameter
b1 = 2
s x
b0 = ý−b1 x́ Constant variable
N
1 Covariance
σx,y: ∑ x i y i−μ x μ y
N i=1
1
sx,y: ¿)
n−1
n
SSE
∑ ( y i−^y i )2
i=1
n
2 SSR
∑ ( ^y i− ý )
i=1
n
SST
∑ ( y i− ý )2
i=1
SST Variantie
σ 2=
n−1
3
, SPSS
Tabellen (SPSS)
Coefficientsa
Standardized 90,0% Confidence
Unstandardized Coefficients Coefficients Interval for B
Lower Upper
Model B Std. Error Beta t Sig. Bound Bound
1
1 (Constant) 990,960 737,919 1,343 ,183 -236,677 2218,59
8
SalePrice 1700,5212 129,8733 ,822 13,0944 ,0005 1484,457 1916,58
4
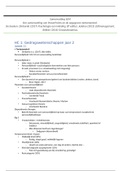
In de bovenstaande tabel is:
1) b0
2) b1
3) sb1 (SE)
β 1−0
4) Waarde van T =
s β1
5) P-value voor toetsingsprobleem c) (tweezijdig) met b=0, handig om te kijken of het model
bruikbaar is. Als die groter is dan alpha, kan H0 niet verworpen worden en is het model
onbruikbaar. Kan ook gebruikt worden als eenzijdige toets met b=0 als dit gedeeld door 2
wordt. Gelijk of kleiner dan alpha betekent dat het significant is. Dit is berekend door het
gebied van de t-waarde in 4) aan beide kanten te berekenen
ANOVAa
Model Sum of Squares df Mean Square F Sig.
1 4 7
1 Regression 3421,921 3 1140,640 1662,866 ,0008
Residual 203,0412 2965 ,6866
Total 3624,9623 299
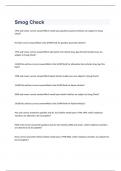
In de bovenstaande table is:
1) SSR
2) SSE
3) SST
4) df1, aantal x’s. Aantal beta’s getoetst
5) df2: n – (k verklarende variabelen (independent variables) + constante variable)
6) Sum of squares / df
7) F-waarde
8) P-value. Is deze kleiner dan α? Dan is het significant en het model bruikbaar.
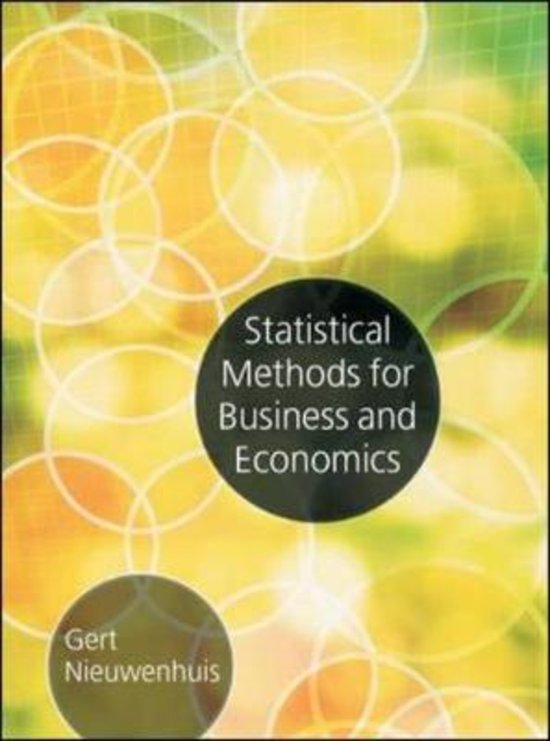
Model Summary
Adjusted R Std. Error of the
Model R R Square Square Estimate
4
Inhoud
Midterm.................................................................................................................................................1
SPSS....................................................................................................................................................4
Tabellen (SPSS)...............................................................................................................................4
Formules (SPSS)..............................................................................................................................6
Herhaling............................................................................................................................................6
Les 1 27-8 (Hoofdstuk 5).....................................................................................................................6
Les 2 2-9 (Hoofdstuk 19).....................................................................................................................7
Les 3 9-9 (Hoofdstuk 19).....................................................................................................................8
Les 4 11-9 (Hoofdstuk 19)...................................................................................................................9
Les 5 16-9 (19.6-19.8, 20.1, 20.2, 20.5)...............................................................................................9
Les 6 18-9..........................................................................................................................................11
Les 7 23-9 (20.3, 20.4, 20.6, 20,7, 21.1)............................................................................................12
Les 8 25-9..........................................................................................................................................14
Tutorial 26-9.....................................................................................................................................14
Les 9 30-9 (21.2-21.5).......................................................................................................................14
Les 10 2-10........................................................................................................................................14
Eindtoets..............................................................................................................................................16
SPSS..................................................................................................................................................16
Tabellen (SPSS).............................................................................................................................16
Formules (SPSS)............................................................................................................................19
Les 11 7-10 (22.1-22.4).....................................................................................................................19
Non-lineairiteit detecteren...........................................................................................................20
Hetroskedasticiteit detecteren.....................................................................................................20
Niet-normaliteit............................................................................................................................21
Dependence of the error terms ε.................................................................................................21
Les 12 21-10......................................................................................................................................22
Les 13 23-10 (21.6)...........................................................................................................................22
Tutorial 31-10...................................................................................................................................23
Les 14 28-10 (24)..............................................................................................................................23
Les 15 30-10 (24)..............................................................................................................................26
Les 16 4-11 (23)................................................................................................................................26
Les 17 6-11 (23)................................................................................................................................27
1
, Tutorial 14-11...................................................................................................................................28
Les 18 11-11 (22.5)...........................................................................................................................28
Les 19 13-11 (22.5)...........................................................................................................................28
Les 20 18-11......................................................................................................................................29
Les 21 20-11......................................................................................................................................30
Tutorial 28-11...................................................................................................................................30
Tips examen......................................................................................................................................30
Tekens
α De kans dat je H0 verwerpt, terwijl het toch niet verworpen kon worden
y Dependent variable
x Independent variable
e Error. The space between the result and the expected value
b0 Constant value. Gebruik deze als de data bekend is
^y Prediction of y (sample regression line)
B0 Constant of the regression line in a sample. Gebruik deze in de formules (er is onzekerheid)
B1 Variable of the regression line in a sample
β0 Constant of the regression line in a population
β1 Variable of the regression line in a population
C The realization of x. {X1 = x1;…; Xn = xn}
s Sample variance of the unrealized x
S Sample variance of the realized x. X1 = x1
x Unrealized value of x, by example in the Expectation E(x)
X Realized value of x, by example in the model Y=Kx
2
r Coefficient of determination
R2 Realized variable r2
radj2 Coefficient of determination, but with an adjustment to have a more realistic indication
k number of variables X (independent variables)
k+1 number of variables X including the constant
yp Point estimator
SSEr Sum of Squared Errors van het gereduceerde model (k-g)
SSEc Sum of Squared Errors van het complete model (k)
g Aantal beta’s in het gereduceerde model
2
Sε Sample variance
Sε Standard error
Formules
(SSEr −SSE c )/(k−g) F-waarde. Invullen geeft de val
F=
SSEc /(n−( k+ 1 ))
R 2 /k
F=
( 1−R2 ) /¿ ¿
k-g Verschil in variabelen tussen het complete model en het
gereduceerde model
SSE Adjusted coefficient of determination
∗n−1
r 2
adj = 1 - SST
n−(k +1)
2
, SSR SSE (Ordinary) coefficient of determination
r 2= =1− = ( r x , y )2
SST SST
B1 −β1 T-waarde van B1. Invullen geeft de val
T=
SB1
B1−β 1 Z-waarde van B1 met een bekende
Z= σε
2
√ ( n−1 ) s x
n
2 1 SSE 2 Sample variance with 1 variable
s=
ε ∑ ( y −^
y) = i i
n−2 i=1 n−2
SSE Sample variance with k variables
Sε2 =
n−( k +1 )
sε Standard deviation b1
sb1 = 2
( n−1 ) s x
sx , y Regression parameter
b1 = 2
s x
b0 = ý−b1 x́ Constant variable
N
1 Covariance
σx,y: ∑ x i y i−μ x μ y
N i=1
1
sx,y: ¿)
n−1
n
SSE
∑ ( y i−^y i )2
i=1
n
2 SSR
∑ ( ^y i− ý )
i=1
n
SST
∑ ( y i− ý )2
i=1
SST Variantie
σ 2=
n−1
3
, SPSS
Tabellen (SPSS)
Coefficientsa
Standardized 90,0% Confidence
Unstandardized Coefficients Coefficients Interval for B
Lower Upper
Model B Std. Error Beta t Sig. Bound Bound
1
1 (Constant) 990,960 737,919 1,343 ,183 -236,677 2218,59
8
SalePrice 1700,5212 129,8733 ,822 13,0944 ,0005 1484,457 1916,58
4
In de bovenstaande tabel is:
1) b0
2) b1
3) sb1 (SE)
β 1−0
4) Waarde van T =
s β1
5) P-value voor toetsingsprobleem c) (tweezijdig) met b=0, handig om te kijken of het model
bruikbaar is. Als die groter is dan alpha, kan H0 niet verworpen worden en is het model
onbruikbaar. Kan ook gebruikt worden als eenzijdige toets met b=0 als dit gedeeld door 2
wordt. Gelijk of kleiner dan alpha betekent dat het significant is. Dit is berekend door het
gebied van de t-waarde in 4) aan beide kanten te berekenen
ANOVAa
Model Sum of Squares df Mean Square F Sig.
1 4 7
1 Regression 3421,921 3 1140,640 1662,866 ,0008
Residual 203,0412 2965 ,6866
Total 3624,9623 299
In de bovenstaande table is:
1) SSR
2) SSE
3) SST
4) df1, aantal x’s. Aantal beta’s getoetst
5) df2: n – (k verklarende variabelen (independent variables) + constante variable)
6) Sum of squares / df
7) F-waarde
8) P-value. Is deze kleiner dan α? Dan is het significant en het model bruikbaar.
Model Summary
Adjusted R Std. Error of the
Model R R Square Square Estimate
4