Introduction to Statistics: Chapter 9
Homework (Inference for Regression)
9.1
A study of all the students at a small college showed a mean age of 20.7 and a standard
deviation of 1 years.
a. Are these numbers statistics or parameters? Explain.
b. Label both numbers with their appropriate symbol (such as x-bar, μ, s, or σ).
a. The numbers are parameters because they are for all the students, not a sample.
b. μ=20.7; σ=1
A survey of 100 random full-time students at a large university showed the mean number of
semester units that students were enrolled in was 10.4 with a standard deviation of 2 units.
a. Are these numbers statistics or parameters? Explain.
b. Label both numbers with their appropriate symbol (such as x-bar, μ, s, or σ).
a. The numbers are statistics because they are for a sample of students, not all students.
b. x-bar=10.4; s = 2
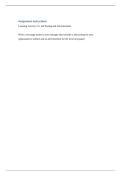
The distribution of the scores on a certain exam is N(40,10), which means that the exam
scores are Normally distributed with a mean of 40 and standard deviation of 10.
a. Sketch the curve and label, on the x-axis, the position of the mean, the mean plus or
minus one standard deviation, the mean plus or minus two standard deviations, and the
mean plus or minus three standard deviations.
b. Find the probability that a randomly selected score will be greater than 50. Shade the
region under the Normal curve whose area corresponds to this probability.
a. graph: +10 standard deviations
b. Using the Empirical Rule, the probability that a randomly selected score will be greater than 50
is about 16% (Graph: Right-shaded).
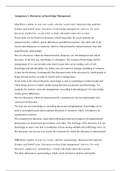
The distribution of the scores on a certain exam is N(70,5), which means that the exam
scores are Normally distributed with a mean of 70 and standard deviation of 5.
a. Sketch the curve and label, on the x-axis, the position of the mean, the mean plus or
minus one standard deviation, the mean plus or minus two standard deviations, and the
mean plus or minus three standard deviations.
b. Find the probability that a randomly selected score will be between 60 and 80. Shade the
region under the Normal curve whose area corresponds to this probability.
a. graph: +5 standard deviations
b. The probability that a randomly selected score will be between 60 and 80 is 95% (Graph:
Shaded between 60 and 80).
According to an online source, the average shower in a country lasts 8.6 minutes. Assume
that this is correct and assume the standard deviation of 3 minutes. Complete parts (a)
through (c) below.
a. Do you expect the shape of the distribution of shower lengths to be Normal, right-skewed, or
left-skewed? Explain your reasoning.
Ans: The distribution will be right-skewed because the values will be mostly small but there will be
a few very large values.
For any inquiries or more discounted documents email: Page 1 of 13
, b. Suppose we survey a random sample of 100 people to find the length of their last shower. We
calculate the mean length from this sample and record the value. We repeat this 500 times. What
will be the shape of the distribution of these sample means?
Ans: The distribution will be approximately Normal because the values will be distributed
symmetrically.
c. Refer to part (b). What will be the mean and standard deviation of the distribution of these
sample means?
Ans: The mean will be 8.6 minutes and the standard deviation will be 3.3 minutes.
According to an online source, the mean time spent on smartphones daily by adults in a
country is 2.65 hours. Assume that this is correct and assume the standard deviation is 1.2
hours. Complete parts (a) and (b) below.
a. Suppose 150 adults in the country are randomly surveyed and asked how long they spend on
their smartphones daily. The mean of the sample is recorded. Then we repeat this process, taking
1000 surveys of 150 adults in the country. What will be the shape of the distribution of these
sample means?
Ans: The distribution will be approximately Normal because the values will be distributed
symmetrically.
b. Refer to part (a). What will be the mean and standard deviation of the distribution of these
sample means?
Ans: The mean will be 2.65 hours and the standard deviation will be .10 hours.
Several times during the year, an organization takes random samples from the population.
One such survey, based on a large (several thousand) sample of randomly selected
households, estimates the mean retirement income to be $21,201 per year. Suppose we
were to make a histogram of all of the retirement incomes from this sample. Would the
histogram be a display of the population distribution, the distribution of a sample, or the
sampling distribution of means?
The histogram would be a display of the distribution of a sample.
A human resources manager for a large company takes a random sample of 50 employees
from the company database. She calculates the mean time that they have been employed.
She records this value and then repeats the process: She takes another random sample of
50 names and calculates the mean employment time. After she has done this 1000 times,
she makes a histogram of the mean employment times. Is this histogram a display of the
population distribution, the distribution of a sample, or the sampling distribution of means?
The histogram is a display of the sampling distribution of means.
9.2
Some sources report that the weights of full-term newborn babies in a certain town have a
mean of 7 pounds and a standard deviation of 1.2 pounds and are normally distributed.
a. What is the probability that one newborn baby will have a weight within 1.2 pounds of the
mean—that is, between 5.8 and 8.2 pounds, or within one standard deviation of the mean?
b. What is the probability that the average of four babies' weights will be within 1.2 pounds
of the mean; will be between 5.8 and 8.2 pounds?
c. Explain the difference between (a) and (b).
a. The probability is 0.6827
b. The probability is 0.9545.
c. The distribution of means is taller and narrower than the original distribution. Therefore, the
distribution of means will have more observations located closer to the center of the distribution.
Some sources report that the weights of full-term newborn babies have a mean of 8 pounds
and a standard deviation of 1.2 pounds and are Normally distributed. In the given outputs,
the shaded areas (reported as p=) represent the probability that the mean will be larger than
For any inquiries or more discounted documents email: Page 2 of 13
Homework (Inference for Regression)
9.1
A study of all the students at a small college showed a mean age of 20.7 and a standard
deviation of 1 years.
a. Are these numbers statistics or parameters? Explain.
b. Label both numbers with their appropriate symbol (such as x-bar, μ, s, or σ).
a. The numbers are parameters because they are for all the students, not a sample.
b. μ=20.7; σ=1
A survey of 100 random full-time students at a large university showed the mean number of
semester units that students were enrolled in was 10.4 with a standard deviation of 2 units.
a. Are these numbers statistics or parameters? Explain.
b. Label both numbers with their appropriate symbol (such as x-bar, μ, s, or σ).
a. The numbers are statistics because they are for a sample of students, not all students.
b. x-bar=10.4; s = 2
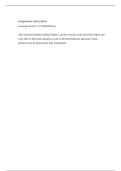
The distribution of the scores on a certain exam is N(40,10), which means that the exam
scores are Normally distributed with a mean of 40 and standard deviation of 10.
a. Sketch the curve and label, on the x-axis, the position of the mean, the mean plus or
minus one standard deviation, the mean plus or minus two standard deviations, and the
mean plus or minus three standard deviations.
b. Find the probability that a randomly selected score will be greater than 50. Shade the
region under the Normal curve whose area corresponds to this probability.
a. graph: +10 standard deviations
b. Using the Empirical Rule, the probability that a randomly selected score will be greater than 50
is about 16% (Graph: Right-shaded).
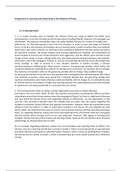
The distribution of the scores on a certain exam is N(70,5), which means that the exam
scores are Normally distributed with a mean of 70 and standard deviation of 5.
a. Sketch the curve and label, on the x-axis, the position of the mean, the mean plus or
minus one standard deviation, the mean plus or minus two standard deviations, and the
mean plus or minus three standard deviations.
b. Find the probability that a randomly selected score will be between 60 and 80. Shade the
region under the Normal curve whose area corresponds to this probability.
a. graph: +5 standard deviations
b. The probability that a randomly selected score will be between 60 and 80 is 95% (Graph:
Shaded between 60 and 80).
According to an online source, the average shower in a country lasts 8.6 minutes. Assume
that this is correct and assume the standard deviation of 3 minutes. Complete parts (a)
through (c) below.
a. Do you expect the shape of the distribution of shower lengths to be Normal, right-skewed, or
left-skewed? Explain your reasoning.
Ans: The distribution will be right-skewed because the values will be mostly small but there will be
a few very large values.
For any inquiries or more discounted documents email: Page 1 of 13
, b. Suppose we survey a random sample of 100 people to find the length of their last shower. We
calculate the mean length from this sample and record the value. We repeat this 500 times. What
will be the shape of the distribution of these sample means?
Ans: The distribution will be approximately Normal because the values will be distributed
symmetrically.
c. Refer to part (b). What will be the mean and standard deviation of the distribution of these
sample means?
Ans: The mean will be 8.6 minutes and the standard deviation will be 3.3 minutes.
According to an online source, the mean time spent on smartphones daily by adults in a
country is 2.65 hours. Assume that this is correct and assume the standard deviation is 1.2
hours. Complete parts (a) and (b) below.
a. Suppose 150 adults in the country are randomly surveyed and asked how long they spend on
their smartphones daily. The mean of the sample is recorded. Then we repeat this process, taking
1000 surveys of 150 adults in the country. What will be the shape of the distribution of these
sample means?
Ans: The distribution will be approximately Normal because the values will be distributed
symmetrically.
b. Refer to part (a). What will be the mean and standard deviation of the distribution of these
sample means?
Ans: The mean will be 2.65 hours and the standard deviation will be .10 hours.
Several times during the year, an organization takes random samples from the population.
One such survey, based on a large (several thousand) sample of randomly selected
households, estimates the mean retirement income to be $21,201 per year. Suppose we
were to make a histogram of all of the retirement incomes from this sample. Would the
histogram be a display of the population distribution, the distribution of a sample, or the
sampling distribution of means?
The histogram would be a display of the distribution of a sample.
A human resources manager for a large company takes a random sample of 50 employees
from the company database. She calculates the mean time that they have been employed.
She records this value and then repeats the process: She takes another random sample of
50 names and calculates the mean employment time. After she has done this 1000 times,
she makes a histogram of the mean employment times. Is this histogram a display of the
population distribution, the distribution of a sample, or the sampling distribution of means?
The histogram is a display of the sampling distribution of means.
9.2
Some sources report that the weights of full-term newborn babies in a certain town have a
mean of 7 pounds and a standard deviation of 1.2 pounds and are normally distributed.
a. What is the probability that one newborn baby will have a weight within 1.2 pounds of the
mean—that is, between 5.8 and 8.2 pounds, or within one standard deviation of the mean?
b. What is the probability that the average of four babies' weights will be within 1.2 pounds
of the mean; will be between 5.8 and 8.2 pounds?
c. Explain the difference between (a) and (b).
a. The probability is 0.6827
b. The probability is 0.9545.
c. The distribution of means is taller and narrower than the original distribution. Therefore, the
distribution of means will have more observations located closer to the center of the distribution.
Some sources report that the weights of full-term newborn babies have a mean of 8 pounds
and a standard deviation of 1.2 pounds and are Normally distributed. In the given outputs,
the shaded areas (reported as p=) represent the probability that the mean will be larger than
For any inquiries or more discounted documents email: Page 2 of 13