Introduction to Statistics: Chapter 14
Homework (Inference for Regression)
14.1
A professor tells his class that he knows their second exam score without their having to
take the test. He tells them that the second exam score can be predicted from the first with
this equation: Predicted second exam score=5+0.75 (first exam score)
This tells us that the deterministic part of the regression model that predicts second exam
score on the basis of first exam score is a straight line. What factor might contribute to the
random component? In other words, why might a student's score not fall exactly on this
line?
The amount of time the student could study
A doctor says he can predict the height (in inches) of a child between 2 and 9 years old
from the child's age (in years) by using the following equation.: Predicted
Height=31.78+2.45 Age
This tells us that the deterministic part of the regression model. What factors might
contribute to the random component? In other words, why might a child's height not fall
exactly on this line?
Diet
The table shows the height (in feet) and the number of floors for five particular buildings.
The regression model for predicting the height from the number of floors is shown below.
Use the table and the regression model to complete parts (a) and (b) below.
Predicted Height=476+4 × (Number of Floors)
Floors: 75, 88, 74, 57, 59
Height: 879, 829, 735, 706
a. Find the predicted values.
Ans: Floors: 75, 88, 74, 57, 59
Predicted Height: 776, 828, 772, 704, 712
b. Find the residuals. (Remember that if the actual value is less than the predicted value, the
residual will have a negative sign.)
Ans: Floors: 75, 88, 74, 57, 59
Residual: 103, 1, −37, 2, 14
NOTE: Actual - Predictual = Residual
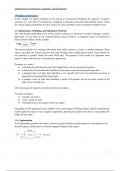
Figure 1 shows a scatterplot of the price and age of a random sample of used cars and
includes the regression line. Figure 2 shows a residual plot based on the regression line.
Complete a and b below.
a. Is the linear regression model appropriate for these data? Explain.
Ans: The residual plot shows that the trend is not a straight line, so the linear condition fails. The
linear model is not appropriate.
b. How old is the car that is farthest from the regression line?
Ans: The farthest car from the regression line is 6 years old.
For any inquiries or more discounted documents email: Page 1 of 6
, NOTE: Look at Figures 1 and Figures 2!
Figure 1 shows a scatterplot for the number of semesters that students have attended a
community college and the number of credits they have accumulated. Figure 2 shows a
residual plot of the same data. These are linked below. Is the linear regression model
appropriate for these data? Why or why not? Assume the observations are independently
measured.
The standard deviation condition does not hold, so the linear model is not appropriate.
NOTE: Look at Figures 1 and Figures 2!
Figure A shows a scatterplot of the current salary (in thousands of dollars per year) and the
beginning salary of many employees at one company. Figure B shows a residual plot of the
same data. Is linear regression appropriate for these data? Why or why not?
Ans: The linear regression model is inappropriate for these data because there is evidence that
the constant SD condition is not met.
NOTE: View the scatterplot and residual plot of employee salaries!
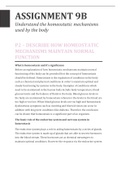
Figure 1 shows a scatterplot of wages of twins for a group of 68 pairs of twins. Figure 2
shows a residual plot of the same data. Figure 3 shows a QQ plot of these residuals. Is the
linear regression model appropriate for these data? Why or why not? Assume the
observations are independently measured.
Is the linear regression model appropriate for these data? Why or why not?
Ans: The residual plot shows an increasing trend, and the QQ plot does not follow a straight line.
Linear regression is inappropriate for this data set, because the linearity condition and the
Normality condition fail.
14.2
Do older college students tend to weigh more than younger college students? Our data are
ages and weights for a random sample of 98 college students. A scatterplot (not shown
here) shows that the association between age and weight is linear. Refer to the Minitab
output given. Complete parts a and b below.
a. According to the equation for weight, do weights tend to be larger or smaller for older students
than for younger students in this sample?
Ans: Older people in the sample tend to weigh a bit more, because the slope is positive.
b. Use the Minitab output to test the hypothesis that the slope is zero in this population using a
significance level of 0.05. State the null and alternative hypotheses. Choose the correct answer
below.
Ans: H0: Slope = 0 and Ha: Slope ≠ 0
Assume that all required conditions are satisfied and that the sample is representative of the
population of all college students. The statistics for the test that the slope is 0 are in the row
labeled "Age."
Find the test statistic.
Ans: t=1.51
Find the p-value for the test.
Ans: The p-value is .134.
Test your hypotheses and state your conclusion in the proper context.
Ans: Do not reject the null hypothesis. There is insufficient evidence of an association between the
weight of a student and their age.
NOTE: Use the Minitab output.
For any inquiries or more discounted documents email: Page 2 of 6
Homework (Inference for Regression)
14.1
A professor tells his class that he knows their second exam score without their having to
take the test. He tells them that the second exam score can be predicted from the first with
this equation: Predicted second exam score=5+0.75 (first exam score)
This tells us that the deterministic part of the regression model that predicts second exam
score on the basis of first exam score is a straight line. What factor might contribute to the
random component? In other words, why might a student's score not fall exactly on this
line?
The amount of time the student could study
A doctor says he can predict the height (in inches) of a child between 2 and 9 years old
from the child's age (in years) by using the following equation.: Predicted
Height=31.78+2.45 Age
This tells us that the deterministic part of the regression model. What factors might
contribute to the random component? In other words, why might a child's height not fall
exactly on this line?
Diet
The table shows the height (in feet) and the number of floors for five particular buildings.
The regression model for predicting the height from the number of floors is shown below.
Use the table and the regression model to complete parts (a) and (b) below.
Predicted Height=476+4 × (Number of Floors)
Floors: 75, 88, 74, 57, 59
Height: 879, 829, 735, 706
a. Find the predicted values.
Ans: Floors: 75, 88, 74, 57, 59
Predicted Height: 776, 828, 772, 704, 712
b. Find the residuals. (Remember that if the actual value is less than the predicted value, the
residual will have a negative sign.)
Ans: Floors: 75, 88, 74, 57, 59
Residual: 103, 1, −37, 2, 14
NOTE: Actual - Predictual = Residual
Figure 1 shows a scatterplot of the price and age of a random sample of used cars and
includes the regression line. Figure 2 shows a residual plot based on the regression line.
Complete a and b below.
a. Is the linear regression model appropriate for these data? Explain.
Ans: The residual plot shows that the trend is not a straight line, so the linear condition fails. The
linear model is not appropriate.
b. How old is the car that is farthest from the regression line?
Ans: The farthest car from the regression line is 6 years old.
For any inquiries or more discounted documents email: Page 1 of 6
, NOTE: Look at Figures 1 and Figures 2!
Figure 1 shows a scatterplot for the number of semesters that students have attended a
community college and the number of credits they have accumulated. Figure 2 shows a
residual plot of the same data. These are linked below. Is the linear regression model
appropriate for these data? Why or why not? Assume the observations are independently
measured.
The standard deviation condition does not hold, so the linear model is not appropriate.
NOTE: Look at Figures 1 and Figures 2!
Figure A shows a scatterplot of the current salary (in thousands of dollars per year) and the
beginning salary of many employees at one company. Figure B shows a residual plot of the
same data. Is linear regression appropriate for these data? Why or why not?
Ans: The linear regression model is inappropriate for these data because there is evidence that
the constant SD condition is not met.
NOTE: View the scatterplot and residual plot of employee salaries!
Figure 1 shows a scatterplot of wages of twins for a group of 68 pairs of twins. Figure 2
shows a residual plot of the same data. Figure 3 shows a QQ plot of these residuals. Is the
linear regression model appropriate for these data? Why or why not? Assume the
observations are independently measured.
Is the linear regression model appropriate for these data? Why or why not?
Ans: The residual plot shows an increasing trend, and the QQ plot does not follow a straight line.
Linear regression is inappropriate for this data set, because the linearity condition and the
Normality condition fail.
14.2
Do older college students tend to weigh more than younger college students? Our data are
ages and weights for a random sample of 98 college students. A scatterplot (not shown
here) shows that the association between age and weight is linear. Refer to the Minitab
output given. Complete parts a and b below.
a. According to the equation for weight, do weights tend to be larger or smaller for older students
than for younger students in this sample?
Ans: Older people in the sample tend to weigh a bit more, because the slope is positive.
b. Use the Minitab output to test the hypothesis that the slope is zero in this population using a
significance level of 0.05. State the null and alternative hypotheses. Choose the correct answer
below.
Ans: H0: Slope = 0 and Ha: Slope ≠ 0
Assume that all required conditions are satisfied and that the sample is representative of the
population of all college students. The statistics for the test that the slope is 0 are in the row
labeled "Age."
Find the test statistic.
Ans: t=1.51
Find the p-value for the test.
Ans: The p-value is .134.
Test your hypotheses and state your conclusion in the proper context.
Ans: Do not reject the null hypothesis. There is insufficient evidence of an association between the
weight of a student and their age.
NOTE: Use the Minitab output.
For any inquiries or more discounted documents email: Page 2 of 6