Applied methods and statistics
Lecture 1 3
Five fundamental relations 3
Lecture 2 4
Assumptions disturbance terms 4
Recursive vs non-recursive models 5
Translating path models into statistical models 5
Solution in SPSS 7
Lecture 3 8
Total causal effect 8
Model implied correlations 8
Model fit 10
Distinguish between saturated and unsaturated models 10
The X2 test for testing the model 11
Lecture 4 moderation mediation 12
Interaction effect 12
The multiple regression model with interactions 12
Mediation using Hayes’ macros 13
Moderation using Hayes’ macros 13
Most relevant output 13
Moderated mediation 14
Lecture 5 Moderation mediation continued 16
Example moderation 16
Example pure moderated mediation 17
Complex moderated mediation models 18
Causal analyses 18
Lecture 6 Factor analysis 19
Principal component analyses 19
Lecture 7 Principal component analysis 21
Give meaning to the components 21
Rotation 21
Lecture 8 Explorative factor analysis 23
The one-factor model 23
Two-factor model 23
Find b1 and b2 23
Applying exploratory factor analysis 24
In SPSS 25
Model fit 26
Lecture 9 Confirmatory factor analysis 27
Example of EFA 27
Confirmatory factor analysis 27
Confirmatory factor analysis in practice 28
, Model fit research 28
X2 test vs RMSEA 29
Lecture 10 Comparing models and SEM 30
Comparing models 30
Structural Equation Modeling (SEM) 30
Lecture 11 all tests 31
,Lecture 1
Learn how to translate a theory into a statistical model.
Manifest variables: directly measurable and observable like age or behavior
Latent variables: measured with dedicated instruments like tests and questionnaires
1. explain the general purpose of path analysis and the importance of path analysis for
theory development in psychology;
2. describe the difference between correlational research and experimental research;
3. describe the differences between raw scores, centered scores, and standardized
scores;
4. identify direct effects, indirect effects, spurious effects, and unknown effects in a
verbal description of the expected relationships or from the conceptual model;
Spurious effect: when two variables are correlated does not mean a causal relationship:
there might be a common cause, a spurious effect.
Causal analyzes are used to rule out spurious effects
What is path model? A hypothesis about underlying causal processes that explain the
observed correlations between two or more variables.
Goal of path analysis: explain why variables correlate.
- Experimental research: active manipulation of the independent variables and random
assignment to experimental conditions
- Correlational research: studying coherence between variables obtained from
surveys, field observations. No manipulation takes place.
Variables: if there is no variation in the variable, then you speak of a constant. Eg if target
population is only girls then gender is a constant in this study.
Hypothesis is a statement about the supposed relationship between two variables, can be
causal or correlational.
Five fundamental relations
Five fundamental relations (possible explanations for the covariance or correlation)
1. Direct effect: changes in X causes changes in Y
2. Indirect effect: changes in X causes changes in M which causes changes in Y
- M is the mediator or intervening variable
3. Spurious relation: Z directly affects X and Z directly affects Y
- Variable Z is the confounder, causes change in both variables
- Correlational research often detects or excludes possible confounders
- Eg gaming and aggression both increased by gender, not by each other
4. Unknown effect: there is an association between X1 and X2 but we have no
theoretical expectation about the direction of the relationship. Presented by a curved
double arrow: we expect a correlation but we don’t know why.
5. Reciprocal effect: a change in X1 causes a change in X2, which in turn causes a
change in X1, which in turn causes a change in X2 etc.
- Complex relation often used to investigate differences in traits and states.
- Often a longitudinal study
, Lecture 2
Path model: a path model is a hypothesis about underlying causal processes that explain
the observed correlations between two or more variables.
Path analysis goal: to empirically investigate whether causal hypotheses about underlying
psychological processes are supported by the data, theory construction & validation.
Within causal models we distinguish between exogenous and endogenous variables
- Exogenous: the variable only acts as a predictor within the
model. It’s not explained by other variables in the model (no
arrow pointed to it)
- Endogenous: the variable is explained by other variables in the
model (at least one arrow points to it). The variable can also
itself be a predictor for another variable in the model.
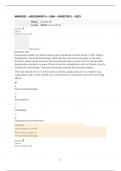
Unexplained variance:
Only part of the variance in sleep quality is explained by worrying, part
of the variance remains unexplained so we speak of error or residual
variance (disturbance terms). (bv. sums of actual grade minus the
predicted grade)
With every endogenous variable there is a residual part: unexplained variance. So each
endogenous variable has a disturbance term that indicates which part of the variance in the
endogenous variable is not explained by other variables in the model. ζ = disturbance terms
Assumptions disturbance terms
1. They are preferably small. The smaller, the greater the explanatory power of the
model.
2. Uncorrelated with each other (independent).
3. Uncorrelated with any of the other variables in the model.
Substantive interpretation
1. All variables have a small effect on the endogenous variables
2. All variable are mutually uncorrelated
3. No spurious relations have been omitted from the model
4. The endogenous variables have been measured with
sufficient reliability.
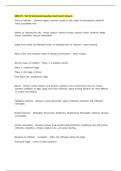
Exogenous variables can correlate with each other, seen with
a curved arrow.
The golden rule
Causal hypotheses can never be proven because there can
always be a spurious relationship due to a confounder.
The golden rule in path analysis to avoid missing a confounder: all variables that can cause
a spurious relationship between two variables with an assumed causal relationship between
them must be included in the model.
Lecture 1 3
Five fundamental relations 3
Lecture 2 4
Assumptions disturbance terms 4
Recursive vs non-recursive models 5
Translating path models into statistical models 5
Solution in SPSS 7
Lecture 3 8
Total causal effect 8
Model implied correlations 8
Model fit 10
Distinguish between saturated and unsaturated models 10
The X2 test for testing the model 11
Lecture 4 moderation mediation 12
Interaction effect 12
The multiple regression model with interactions 12
Mediation using Hayes’ macros 13
Moderation using Hayes’ macros 13
Most relevant output 13
Moderated mediation 14
Lecture 5 Moderation mediation continued 16
Example moderation 16
Example pure moderated mediation 17
Complex moderated mediation models 18
Causal analyses 18
Lecture 6 Factor analysis 19
Principal component analyses 19
Lecture 7 Principal component analysis 21
Give meaning to the components 21
Rotation 21
Lecture 8 Explorative factor analysis 23
The one-factor model 23
Two-factor model 23
Find b1 and b2 23
Applying exploratory factor analysis 24
In SPSS 25
Model fit 26
Lecture 9 Confirmatory factor analysis 27
Example of EFA 27
Confirmatory factor analysis 27
Confirmatory factor analysis in practice 28
, Model fit research 28
X2 test vs RMSEA 29
Lecture 10 Comparing models and SEM 30
Comparing models 30
Structural Equation Modeling (SEM) 30
Lecture 11 all tests 31
,Lecture 1
Learn how to translate a theory into a statistical model.
Manifest variables: directly measurable and observable like age or behavior
Latent variables: measured with dedicated instruments like tests and questionnaires
1. explain the general purpose of path analysis and the importance of path analysis for
theory development in psychology;
2. describe the difference between correlational research and experimental research;
3. describe the differences between raw scores, centered scores, and standardized
scores;
4. identify direct effects, indirect effects, spurious effects, and unknown effects in a
verbal description of the expected relationships or from the conceptual model;
Spurious effect: when two variables are correlated does not mean a causal relationship:
there might be a common cause, a spurious effect.
Causal analyzes are used to rule out spurious effects
What is path model? A hypothesis about underlying causal processes that explain the
observed correlations between two or more variables.
Goal of path analysis: explain why variables correlate.
- Experimental research: active manipulation of the independent variables and random
assignment to experimental conditions
- Correlational research: studying coherence between variables obtained from
surveys, field observations. No manipulation takes place.
Variables: if there is no variation in the variable, then you speak of a constant. Eg if target
population is only girls then gender is a constant in this study.
Hypothesis is a statement about the supposed relationship between two variables, can be
causal or correlational.
Five fundamental relations
Five fundamental relations (possible explanations for the covariance or correlation)
1. Direct effect: changes in X causes changes in Y
2. Indirect effect: changes in X causes changes in M which causes changes in Y
- M is the mediator or intervening variable
3. Spurious relation: Z directly affects X and Z directly affects Y
- Variable Z is the confounder, causes change in both variables
- Correlational research often detects or excludes possible confounders
- Eg gaming and aggression both increased by gender, not by each other
4. Unknown effect: there is an association between X1 and X2 but we have no
theoretical expectation about the direction of the relationship. Presented by a curved
double arrow: we expect a correlation but we don’t know why.
5. Reciprocal effect: a change in X1 causes a change in X2, which in turn causes a
change in X1, which in turn causes a change in X2 etc.
- Complex relation often used to investigate differences in traits and states.
- Often a longitudinal study
, Lecture 2
Path model: a path model is a hypothesis about underlying causal processes that explain
the observed correlations between two or more variables.
Path analysis goal: to empirically investigate whether causal hypotheses about underlying
psychological processes are supported by the data, theory construction & validation.
Within causal models we distinguish between exogenous and endogenous variables
- Exogenous: the variable only acts as a predictor within the
model. It’s not explained by other variables in the model (no
arrow pointed to it)
- Endogenous: the variable is explained by other variables in the
model (at least one arrow points to it). The variable can also
itself be a predictor for another variable in the model.
Unexplained variance:
Only part of the variance in sleep quality is explained by worrying, part
of the variance remains unexplained so we speak of error or residual
variance (disturbance terms). (bv. sums of actual grade minus the
predicted grade)
With every endogenous variable there is a residual part: unexplained variance. So each
endogenous variable has a disturbance term that indicates which part of the variance in the
endogenous variable is not explained by other variables in the model. ζ = disturbance terms
Assumptions disturbance terms
1. They are preferably small. The smaller, the greater the explanatory power of the
model.
2. Uncorrelated with each other (independent).
3. Uncorrelated with any of the other variables in the model.
Substantive interpretation
1. All variables have a small effect on the endogenous variables
2. All variable are mutually uncorrelated
3. No spurious relations have been omitted from the model
4. The endogenous variables have been measured with
sufficient reliability.
Exogenous variables can correlate with each other, seen with
a curved arrow.
The golden rule
Causal hypotheses can never be proven because there can
always be a spurious relationship due to a confounder.
The golden rule in path analysis to avoid missing a confounder: all variables that can cause
a spurious relationship between two variables with an assumed causal relationship between
them must be included in the model.