Statistical Modeling for Communication Research
NOTES - BOTH BOOK & LECTURE
WEEK 1
Chapter 1: Statistical Inference
● Sample statistics: A number describing a characteristic of a sample.
○ The number of yellow candies in the sample (bag) is the sample statistic
● Expected value/ Expectation: The mean of a probability distribution, such as a sampling
distribution.
○ The mean of the sampling distribution of the sample proportion = the population
proportion
Statistical inference統計推論: generalization from the data collected in a random sample to the
population from which the sample was drawn.
● Offers techniques for making statements about a larger set of observations from data collected for
a smaller set of observations
● Types of statistical inference:
○ Estimation
○ Null hypothesis testing
Sampling distribution: Focuses on samples not on the individual items
● 1 sample = 1 observation
● Definition: All possible sample statistic values and their probabilities or probability densities.
● Sampling distributions are the central element in estimation and null hypothesis testing
● Simulation means that we let a computer draw many random samples from a population
● Sampling distribution contains very many samples
○ The population and the sample consist of the same type of observations.
■ E.g. we are dealing with a sample and a population of candies
○ The sampling distribution is based on a different type of observation, namely samples
■ E.g. sample bags of candies.
1. Draw thousands of samples → Sampling distribution
2. Calculate the mean of sampling distribution (Expected value)
→ The true population value
● The mean of the sampling distribution = The expected value of the sample statistic.
● The mean of the sampling distribution of the sample proportion = The population proportion
1
,Samples requirements:
1. Random samples
a. Definition: A variable with values that depend on chance.
2. Unbiased estimator of the population
3. Continuous vs. Discrete: Probability Density vs. Probabilities
4. Impractical → Too much time for research on a single sample if too many samples were selected
Probability distribution
A Continuous Random variable
● **Probability density: A means of getting the probability that a continuous random variable
(like a sample statistics) falls within a particular range.
● Weight is a continuous variable because we can always think of a new weight between two other
weights
○ E.g. consider two candy weights: 2.8 and 2.81 grams. It is easy to see that there can be a
weight in between these two values, e.g., 2.803 grams
2
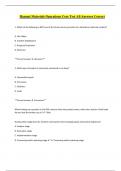
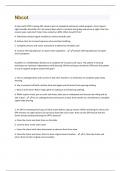
, ● Probability of buying a bag with average candy weight between 2.6 and 2.7 grams = 0.064
● Probability of buying a bag with average candy weight of 2.8 or any specific number = 0
**Population mean = Expected value
of the sampling distribution = Average
of the sampling distribution
Unbiased estimator: A sample
statistics for which the expected value
equals the population value.
**A sample is representative of a
population if the variables in the
sample are distributed in the same way
as in the population
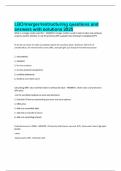
A Discrete Random Variable
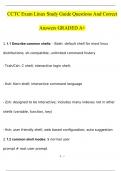
● **Probabilities: Displayed probabilities always add up to 1
● All possible outcome scores constitute the sampling space
○ Sampling space: All possible sample statistics values.
3
, ■ Example: All values that the sample statistic “Number of yellow candies in the
sample” can take
● The sample statistic is called a random variable → different samples can have different scores
● Tells us all possible samples that we could have
drawn
● Displays the probabilities of a sample bag with a
particular number of yellow candies if 20% of
the candies in the population are yellow
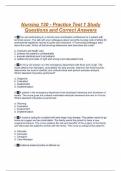
Empirical cycle - Hypothetico-deductive approach
1. Observation
Sparks idea for hypothesis pattern, unexpected event, interesting relation we want to explain
(e.g. personal observation, experience, an imaginary observation)
● Observing relation in one or more instances
● Idea for hypothesis
● Example: Patient is showing post traumatic symptoms
2. Induction
With inductive reasoning relation in specific instances is transformed into general rules
● Inductive inference: Relations holds in specific cases ⇒ Relations holds in all cases
● General rule
● Hypothesis
● Example: Can we diagnose PTSD
3. Deduction
4
NOTES - BOTH BOOK & LECTURE
WEEK 1
Chapter 1: Statistical Inference
● Sample statistics: A number describing a characteristic of a sample.
○ The number of yellow candies in the sample (bag) is the sample statistic
● Expected value/ Expectation: The mean of a probability distribution, such as a sampling
distribution.
○ The mean of the sampling distribution of the sample proportion = the population
proportion
Statistical inference統計推論: generalization from the data collected in a random sample to the
population from which the sample was drawn.
● Offers techniques for making statements about a larger set of observations from data collected for
a smaller set of observations
● Types of statistical inference:
○ Estimation
○ Null hypothesis testing
Sampling distribution: Focuses on samples not on the individual items
● 1 sample = 1 observation
● Definition: All possible sample statistic values and their probabilities or probability densities.
● Sampling distributions are the central element in estimation and null hypothesis testing
● Simulation means that we let a computer draw many random samples from a population
● Sampling distribution contains very many samples
○ The population and the sample consist of the same type of observations.
■ E.g. we are dealing with a sample and a population of candies
○ The sampling distribution is based on a different type of observation, namely samples
■ E.g. sample bags of candies.
1. Draw thousands of samples → Sampling distribution
2. Calculate the mean of sampling distribution (Expected value)
→ The true population value
● The mean of the sampling distribution = The expected value of the sample statistic.
● The mean of the sampling distribution of the sample proportion = The population proportion
1
,Samples requirements:
1. Random samples
a. Definition: A variable with values that depend on chance.
2. Unbiased estimator of the population
3. Continuous vs. Discrete: Probability Density vs. Probabilities
4. Impractical → Too much time for research on a single sample if too many samples were selected
Probability distribution
A Continuous Random variable
● **Probability density: A means of getting the probability that a continuous random variable
(like a sample statistics) falls within a particular range.
● Weight is a continuous variable because we can always think of a new weight between two other
weights
○ E.g. consider two candy weights: 2.8 and 2.81 grams. It is easy to see that there can be a
weight in between these two values, e.g., 2.803 grams
2
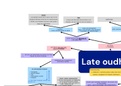
, ● Probability of buying a bag with average candy weight between 2.6 and 2.7 grams = 0.064
● Probability of buying a bag with average candy weight of 2.8 or any specific number = 0
**Population mean = Expected value
of the sampling distribution = Average
of the sampling distribution
Unbiased estimator: A sample
statistics for which the expected value
equals the population value.
**A sample is representative of a
population if the variables in the
sample are distributed in the same way
as in the population
A Discrete Random Variable
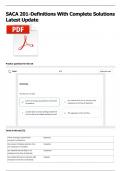
● **Probabilities: Displayed probabilities always add up to 1
● All possible outcome scores constitute the sampling space
○ Sampling space: All possible sample statistics values.
3
, ■ Example: All values that the sample statistic “Number of yellow candies in the
sample” can take
● The sample statistic is called a random variable → different samples can have different scores
● Tells us all possible samples that we could have
drawn
● Displays the probabilities of a sample bag with a
particular number of yellow candies if 20% of
the candies in the population are yellow
Empirical cycle - Hypothetico-deductive approach
1. Observation
Sparks idea for hypothesis pattern, unexpected event, interesting relation we want to explain
(e.g. personal observation, experience, an imaginary observation)
● Observing relation in one or more instances
● Idea for hypothesis
● Example: Patient is showing post traumatic symptoms
2. Induction
With inductive reasoning relation in specific instances is transformed into general rules
● Inductive inference: Relations holds in specific cases ⇒ Relations holds in all cases
● General rule
● Hypothesis
● Example: Can we diagnose PTSD
3. Deduction
4