Portfolio Management
20. Portfolio risk and return: part1
1. Risk aversion and CAL
1. Risk and Return of Major Asset Classes in U.S.
a. Evaluating investments using E[R] and σ is a simplification because returns do not follow a normal
distribution;
b. Distributions are negatively skewed, with greater kurtosis(fatter tail)
i. The negative skew reflects a tendency towards large downside deviations, positive excess
kurtosis reflects frequent extreme deviations on both upside and downside.
2. Risk averse
a. When the expected returns are equal, risk-averse investor will always prefer the less risky portfolio.
b. Financial models assume all investors are risk averse.
3. Investors' Utility function
a. represent their preferences regarding the tradeoff between risk and return
1
b. U = E(r) − Aσ 2
2
4. Indifference curve
a. Indifference curves slope upward for risk-averse investors, because they will take on more risk only given
greater E[R]
b. An indifference curves of risk-averse investor will be steeper, reflecting a higher risk aversion coefficient.
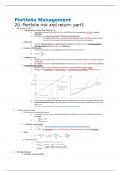
5. Capital allocation line(CAL)
a. Investors' utility function : preferences regarding the trade-off between risk and return
b. The CAL is the combinations of risk-free assets and optimal risky asset portfolio(indifference curve)
c.
d. less risk averse investor should optimally choose a portfolio with more risky asset and less risk-free asset.
e. two-fund separation theorem : an optimal portfolio will be made up of some combination of risky assets
and Rf asset
f. CAL does not change based on the preferences of different investors.
2. Portfolio standard deviation
1. σ2 of returns for an individual security
a. In the world of finance, we are typically analyzing only a sample of returns data, rather than the entire
population.
b.
2. Correlation and Covariance
a. : When calculating covariance, the portfolio weights are not relevant.
b. : the covariance can be standardized by dividing by the product of σ of two securities.
3. Beta
a. / /
3. Portfolio σ and σ2
1.
4. The efficient frontier
1. Minimum variance portfolios
, a. Minimum variance portfolio : the lowest σ of all portfolios with a given E[R]
b. Together, they make up the minimum-variance frontier = efficient frontier
2. Efficient frontier
a. The set of portfolios on the minimum-variance frontier that dominates all sets of portfolios below the
global minimum-variance portfolio
b. A portfolios that have the greatest E[R] for each level of risk / lowest amount of risk for a given level of E[R]
c. A risk-averse investor would only choose portfolios on the efficient frontier
d. Global minimum-variance portfolio : The portfolio on the efficient frontier that has the least risk portfolio.
e.
21. Portfolio risk and return: part2
1. Systematic risk and beta
1. CAL - capital allocation line
a.
b. The point of tangency between CAL and the efficient frontier of risky assets
c. Best CAL : offering the most-preferred set of portfolios in risk and return.
d. If each investor has different expectations about E[R], σ , or correlations, each investor will have a different
optimal risky asset portfolio and a different CAL
e. A simplifying assumption underlying modern portfolio theory CAPM is that investors have homogeneous
Expectations
i. Under this assumption, all investors face the same efficient frontier of risky portfolios and will
have same optimal risky portfolio and CAL.
ii. Under this assumption -> all CALs => CAL = CML
2. CML - Capital market line
a.
b. CML: the optimal CAL that is just tangent to efficient frontier.
i. Combination of risk-free asset the market portfolio.
c. Under the assumption of homogeneous expectations, this optimal CAL for all investors is termed the capital
market line (CML).
d. Every investor, will use the same risky portfolio.
i. When this is the case, that portfolio must be the market portfolio of all risky assets because all
investors that hold any risky assets hold the same portfolio of risky assets.
e. CML = total risk = systematic risk + unsystematic risk
i.
, ii.
2. Beta, CAPM and SML
1. Beta
a. Beta: standardized measure of the covariance of asset's return with market return
i. sensitivity of an asset's return to the return on the market index
b.
c. ->
2. SML
a. SML : plotting the relationship between risk and return for individual assets using Covi,mkt
i. Given that the only relevant risk for Asset i is measured by Covi,mkt
b.
c.
3. CAPM
a. CAPM : the relation between beta and E[RP]
b. we can define beta, as a standardized measure of systematic risk.
c. It measures the relationship between a security's excess returns and the excess returns to the market
portfolio.
i.
d.
4. CAPM assumption
a. Risk aversion : To accept a greater degree of risk, investors require a higher E[R].
b. Utility maximizing investors. : Investors choose the portfolio with the risk and return combination that
maximizes their utility.
c. Frictionless markets : no taxes, transaction costs, or other impediments to trading.
d. One-period horizon : All investors have the same one-period time horizon.
e. Homogeneous expectations : All investors have the same expectations for assets’ E[R], SD, and Corr
f. Divisible assets : All investments are infinitely divisible.
g. Competitive markets : Investors take the market price as given and no investor can influence the price
3. Comparing CML and SML
1. CML use Total risk(systematic + unsystematic risk)
a. only efficient portfolios will plot on the CML
20. Portfolio risk and return: part1
1. Risk aversion and CAL
1. Risk and Return of Major Asset Classes in U.S.
a. Evaluating investments using E[R] and σ is a simplification because returns do not follow a normal
distribution;
b. Distributions are negatively skewed, with greater kurtosis(fatter tail)
i. The negative skew reflects a tendency towards large downside deviations, positive excess
kurtosis reflects frequent extreme deviations on both upside and downside.
2. Risk averse
a. When the expected returns are equal, risk-averse investor will always prefer the less risky portfolio.
b. Financial models assume all investors are risk averse.
3. Investors' Utility function
a. represent their preferences regarding the tradeoff between risk and return
1
b. U = E(r) − Aσ 2
2
4. Indifference curve
a. Indifference curves slope upward for risk-averse investors, because they will take on more risk only given
greater E[R]
b. An indifference curves of risk-averse investor will be steeper, reflecting a higher risk aversion coefficient.
5. Capital allocation line(CAL)
a. Investors' utility function : preferences regarding the trade-off between risk and return
b. The CAL is the combinations of risk-free assets and optimal risky asset portfolio(indifference curve)
c.
d. less risk averse investor should optimally choose a portfolio with more risky asset and less risk-free asset.
e. two-fund separation theorem : an optimal portfolio will be made up of some combination of risky assets
and Rf asset
f. CAL does not change based on the preferences of different investors.
2. Portfolio standard deviation
1. σ2 of returns for an individual security
a. In the world of finance, we are typically analyzing only a sample of returns data, rather than the entire
population.
b.
2. Correlation and Covariance
a. : When calculating covariance, the portfolio weights are not relevant.
b. : the covariance can be standardized by dividing by the product of σ of two securities.
3. Beta
a. / /
3. Portfolio σ and σ2
1.
4. The efficient frontier
1. Minimum variance portfolios
, a. Minimum variance portfolio : the lowest σ of all portfolios with a given E[R]
b. Together, they make up the minimum-variance frontier = efficient frontier
2. Efficient frontier
a. The set of portfolios on the minimum-variance frontier that dominates all sets of portfolios below the
global minimum-variance portfolio
b. A portfolios that have the greatest E[R] for each level of risk / lowest amount of risk for a given level of E[R]
c. A risk-averse investor would only choose portfolios on the efficient frontier
d. Global minimum-variance portfolio : The portfolio on the efficient frontier that has the least risk portfolio.
e.
21. Portfolio risk and return: part2
1. Systematic risk and beta
1. CAL - capital allocation line
a.
b. The point of tangency between CAL and the efficient frontier of risky assets
c. Best CAL : offering the most-preferred set of portfolios in risk and return.
d. If each investor has different expectations about E[R], σ , or correlations, each investor will have a different
optimal risky asset portfolio and a different CAL
e. A simplifying assumption underlying modern portfolio theory CAPM is that investors have homogeneous
Expectations
i. Under this assumption, all investors face the same efficient frontier of risky portfolios and will
have same optimal risky portfolio and CAL.
ii. Under this assumption -> all CALs => CAL = CML
2. CML - Capital market line
a.
b. CML: the optimal CAL that is just tangent to efficient frontier.
i. Combination of risk-free asset the market portfolio.
c. Under the assumption of homogeneous expectations, this optimal CAL for all investors is termed the capital
market line (CML).
d. Every investor, will use the same risky portfolio.
i. When this is the case, that portfolio must be the market portfolio of all risky assets because all
investors that hold any risky assets hold the same portfolio of risky assets.
e. CML = total risk = systematic risk + unsystematic risk
i.
, ii.
2. Beta, CAPM and SML
1. Beta
a. Beta: standardized measure of the covariance of asset's return with market return
i. sensitivity of an asset's return to the return on the market index
b.
c. ->
2. SML
a. SML : plotting the relationship between risk and return for individual assets using Covi,mkt
i. Given that the only relevant risk for Asset i is measured by Covi,mkt
b.
c.
3. CAPM
a. CAPM : the relation between beta and E[RP]
b. we can define beta, as a standardized measure of systematic risk.
c. It measures the relationship between a security's excess returns and the excess returns to the market
portfolio.
i.
d.
4. CAPM assumption
a. Risk aversion : To accept a greater degree of risk, investors require a higher E[R].
b. Utility maximizing investors. : Investors choose the portfolio with the risk and return combination that
maximizes their utility.
c. Frictionless markets : no taxes, transaction costs, or other impediments to trading.
d. One-period horizon : All investors have the same one-period time horizon.
e. Homogeneous expectations : All investors have the same expectations for assets’ E[R], SD, and Corr
f. Divisible assets : All investments are infinitely divisible.
g. Competitive markets : Investors take the market price as given and no investor can influence the price
3. Comparing CML and SML
1. CML use Total risk(systematic + unsystematic risk)
a. only efficient portfolios will plot on the CML