Unit 13 - Economic fluctuations and unemployment
13.1 Growth and fluctuations
● Economies growth through many booms and recessions and growth is not smooth
● There is no standard definition fo a recession but the NBER defines it as a significant
decline in economic activity that spread across the economy and can last from a few
months to more than a year.
● Alternatively, some say: It is a period when the level of output is below the normal
level (even if the economy is growing) - controversy over that is ‘normal’
● Business cycle = movement from boom to recession to boom
13.2 Output growth and changes in unemployment
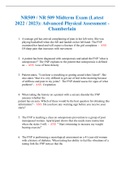
Okun’s law
● This shows the relationship between output and unemployment fluctuations
● Arthur Okun noticed that when output is high, unemployment decreases.
● If the two variables are plotted that is a negative correlation
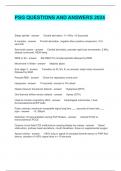
The law is defined as:
● Δ ut = the change in the unemployment rate at
the time t
● α = intercept value
● β = is a coefficient determined how real GDP growth is predicted to be translated into
a change in the unemployment rate (Okun’s coefficient)
● When a line of best fit is calculated we can see how well Okun’s law approximates
the data.
● E.g. R^2 stat for Germany is 0.22 but Okun’s law estimation of 0.64
NB: A fall in output growth = a rise in unemployment = a fall in wellbeing
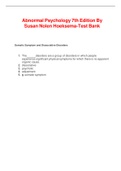
13.3 Measuring the aggregate economy
● Aggregate output (GDP) = output of all producer in a country
● National accounts = statistics publish by the NSO to give a picture of the economy as
a whole. This is done in 3 ways...
1. Spending; the total spent by households, firms, the government and resident
of other countries on the home countries exports
2. Production; The total produced by the industries that operate in the home
economy (measured by value-added to avoid double counting
3. Income: The sum of all the incomes recieved, comprising wages, profits and
the income of self-employed and taxes received by the government.
Circular Flow of income
13.1 Growth and fluctuations
● Economies growth through many booms and recessions and growth is not smooth
● There is no standard definition fo a recession but the NBER defines it as a significant
decline in economic activity that spread across the economy and can last from a few
months to more than a year.
● Alternatively, some say: It is a period when the level of output is below the normal
level (even if the economy is growing) - controversy over that is ‘normal’
● Business cycle = movement from boom to recession to boom
13.2 Output growth and changes in unemployment
Okun’s law
● This shows the relationship between output and unemployment fluctuations
● Arthur Okun noticed that when output is high, unemployment decreases.
● If the two variables are plotted that is a negative correlation
The law is defined as:
● Δ ut = the change in the unemployment rate at
the time t
● α = intercept value
● β = is a coefficient determined how real GDP growth is predicted to be translated into
a change in the unemployment rate (Okun’s coefficient)
● When a line of best fit is calculated we can see how well Okun’s law approximates
the data.
● E.g. R^2 stat for Germany is 0.22 but Okun’s law estimation of 0.64
NB: A fall in output growth = a rise in unemployment = a fall in wellbeing
13.3 Measuring the aggregate economy
● Aggregate output (GDP) = output of all producer in a country
● National accounts = statistics publish by the NSO to give a picture of the economy as
a whole. This is done in 3 ways...
1. Spending; the total spent by households, firms, the government and resident
of other countries on the home countries exports
2. Production; The total produced by the industries that operate in the home
economy (measured by value-added to avoid double counting
3. Income: The sum of all the incomes recieved, comprising wages, profits and
the income of self-employed and taxes received by the government.
Circular Flow of income