LOOK AT CHINA AND SOUTH AFRICA CASE STUDIES ON POPULATION DISTRIBUTION AND INTERNAL
MIGRATION
REFER TO MIGRATION CASE STUDIES FOR NIGER AND SYRIA
Factors affecting population distribution at a global scale
Development: Countries seeking to develop economically and improve the quality of life for their inhabitants.
One indicator of development is average income.
Distribution: The pattern of where people live.
Density: How many people live in a certain area (per km squared).
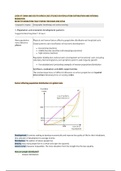
Lorenz curve: measures inequalities. The more deviation from the straight line the less equality.
How are people distributed?
- Uneven distribution.
, - Many live along coastlines. This explains the lorenz curve.
- Several regions are uninhabitable.
What are the advantageous and disadvantageous physical factors that affect population distribution?
Advantages Disadvantages
Close proximity to the sea Dry/drought
¾ of the world’s population live within 1000 km of Sahel region
the sea.
Low ground, flat ground Steep, high plateaux, rugged mountains
90% of the world’s population live in areas less than (inaccessible land)
500 m high.
Fertile river valleys Harsh weather conditions
SEA is monsoonal, fluctuates between flood and
drought.
Places with regular water supply Insufficient water supply
Good communications and the potential to trade Dense forests that limit activity
Natural resources Infertile land, frozen soils, eroded soils
What are some human factors that affect population distribution?
Disadvantageous Advantageous
Low state investment Ports
Lack of technology for water or transportation Distribution of raw materials
Coal, mineral resources, led to development in UAE
Extensive agriculture Good technology
Desalination plants in Middle East
Employment opportunities
Urban areas
Government policy
South Africa’s apartheid policy led to redistribution
of people.
Town policies
Creation of towns like Milton Keynes led to the
redistribution of people.
Influence of conflict and war
Syria’s civil war led to the loss of population.
Migration of people, forced or voluntary
Somali migrants moved to Kenya.
Irrigation technology
How are hazards and resources linked? (they have a complex and dynamic relationship)
,A coastline can be a resource as it allows for trade but it is also associated with risks like flooding. Technology
can help reduce hazards.
Global patterns and classification of economic development
What are the annual incomes of people in HICs, UMICs, MICs, LMICs and LICs?
HIC/core→ over $12,476
UMIC/semi-periphery → $4,036 - $12,475
LMIC→ between $1,025 - 4,035
LIC/periphery→ less than $1025
Backflow: flow of people and resources from periphery to core. It is responsible for the polarization of regional
prosperity.
Core-periphery system: uneven spatial distribution of population and wealth between two regions of a
country, leading to migrant trade flows and investment.
Internal migration: movement of people within the borders.
Why do imbalances arise in regions between core and peripheries? What percentage of the population will
live in cities in 2040?
- Voluntary internal migration usually from rural to urban areas. Urban to rural migration is the most
significant movement of people.
- 70%.
Why are the number of cores increasing?
- More cores develop over time the growth of them is fuelled b the flow of raw materials, workers and
neighbouring areas.
What is the brandt line?
A 1980s concept used to highlight the growing gap in social and economic development between developed
and developing countries. It divided the ‘The North’ from ‘The South’, the north being the core countries and
the south being the periphery countries.
Globalization: increased connectedness between places, usually through TNCs.
TNCs:business operations that spread across the world, they bring cultural change and are usually of
recognizable brands e.g. Starbucks.
What are the different economic classifications, the examples of countries for each and their characteristics?
Economic classification Examples of countries Country characteristics
MEDC Japan, Germany High standard of living.
More economically developed Developed.
countries Post industrial.
HIC
NIC Malaysia, Taiwan Rapid industrial, social and
Newly industrializing countries BRIC countries (Brazil, Russia, economic growth since 1960.
India and China) Rapid factory expansion and
MINT countries (Mexico, spread of TNCs/globalization.
Indonesia, Nigeria and Turkey) Growing middle class.
CEP North Korea Socialist countries under strict
, Centrally planned economies Some former communist countries government control.
Living standards are higher than
LEDCs.
Personal freedom may be limited.
Oil rich countries Saudi Arabia, UAE Rich by income per head but
wealth is usually not distributed
evenly.
LEC Pakistan, Kenya At a lower stage of development.
Less economically developed Lower quality of life.
countries Failed states.
LIC Politically unstable.
Low income countries Large agricultural sector.
LDC Afghanistan, Eritrea, Somalia Very low standards of living.
Least developed countries Perhaps due to conflicts.
Failed states.
Politically unstable.
What are the difficulties of using classifications of development?
- Development is hard to define.
- There is a range of development.
- There is both human and economic development.
GDP: a measure of the output of final goods and services.
Purchasing power parity: a measure of average wealth that takes into account the cost of typical basket
goods.
Informal sector: unofficial forms of employment that are not easily made to government regulation and
taxation. It is usually the employment of those that are poorly educated.
What is GDP? Why is it hard to calculate?
- Widely used to measure national economic wealth, one of the best known measurements of global
prosperity.
- There are numerous earnings that are hard to record e.g. the informal sector and the unemployed.
How is it measured?
- Individual countries agree on the guidelines overseen by the UN to calculate it. There is a weighing
between agriculture and industry. It varies for each country and as a country rapidly develops.
- Figures are verified by the World Bank and IMF.
- The numbers are then converted into dollars to make it comparable.
- PPP is calculated.
Why did Nigeria’s GDP ‘grow overnight’?
- They used an outdated formula created in 1990 that did not account for their ‘Nollywood’, movie
industry and they decreased their agricultural share.
- This meant that their GDP went up by 89% within a year between 2012-2013.
What are urban pull factors? Rural push factors?
Urban pull Rural push
MIGRATION
REFER TO MIGRATION CASE STUDIES FOR NIGER AND SYRIA
Factors affecting population distribution at a global scale
Development: Countries seeking to develop economically and improve the quality of life for their inhabitants.
One indicator of development is average income.
Distribution: The pattern of where people live.
Density: How many people live in a certain area (per km squared).
Lorenz curve: measures inequalities. The more deviation from the straight line the less equality.
How are people distributed?
- Uneven distribution.
, - Many live along coastlines. This explains the lorenz curve.
- Several regions are uninhabitable.
What are the advantageous and disadvantageous physical factors that affect population distribution?
Advantages Disadvantages
Close proximity to the sea Dry/drought
¾ of the world’s population live within 1000 km of Sahel region
the sea.
Low ground, flat ground Steep, high plateaux, rugged mountains
90% of the world’s population live in areas less than (inaccessible land)
500 m high.
Fertile river valleys Harsh weather conditions
SEA is monsoonal, fluctuates between flood and
drought.
Places with regular water supply Insufficient water supply
Good communications and the potential to trade Dense forests that limit activity
Natural resources Infertile land, frozen soils, eroded soils
What are some human factors that affect population distribution?
Disadvantageous Advantageous
Low state investment Ports
Lack of technology for water or transportation Distribution of raw materials
Coal, mineral resources, led to development in UAE
Extensive agriculture Good technology
Desalination plants in Middle East
Employment opportunities
Urban areas
Government policy
South Africa’s apartheid policy led to redistribution
of people.
Town policies
Creation of towns like Milton Keynes led to the
redistribution of people.
Influence of conflict and war
Syria’s civil war led to the loss of population.
Migration of people, forced or voluntary
Somali migrants moved to Kenya.
Irrigation technology
How are hazards and resources linked? (they have a complex and dynamic relationship)
,A coastline can be a resource as it allows for trade but it is also associated with risks like flooding. Technology
can help reduce hazards.
Global patterns and classification of economic development
What are the annual incomes of people in HICs, UMICs, MICs, LMICs and LICs?
HIC/core→ over $12,476
UMIC/semi-periphery → $4,036 - $12,475
LMIC→ between $1,025 - 4,035
LIC/periphery→ less than $1025
Backflow: flow of people and resources from periphery to core. It is responsible for the polarization of regional
prosperity.
Core-periphery system: uneven spatial distribution of population and wealth between two regions of a
country, leading to migrant trade flows and investment.
Internal migration: movement of people within the borders.
Why do imbalances arise in regions between core and peripheries? What percentage of the population will
live in cities in 2040?
- Voluntary internal migration usually from rural to urban areas. Urban to rural migration is the most
significant movement of people.
- 70%.
Why are the number of cores increasing?
- More cores develop over time the growth of them is fuelled b the flow of raw materials, workers and
neighbouring areas.
What is the brandt line?
A 1980s concept used to highlight the growing gap in social and economic development between developed
and developing countries. It divided the ‘The North’ from ‘The South’, the north being the core countries and
the south being the periphery countries.
Globalization: increased connectedness between places, usually through TNCs.
TNCs:business operations that spread across the world, they bring cultural change and are usually of
recognizable brands e.g. Starbucks.
What are the different economic classifications, the examples of countries for each and their characteristics?
Economic classification Examples of countries Country characteristics
MEDC Japan, Germany High standard of living.
More economically developed Developed.
countries Post industrial.
HIC
NIC Malaysia, Taiwan Rapid industrial, social and
Newly industrializing countries BRIC countries (Brazil, Russia, economic growth since 1960.
India and China) Rapid factory expansion and
MINT countries (Mexico, spread of TNCs/globalization.
Indonesia, Nigeria and Turkey) Growing middle class.
CEP North Korea Socialist countries under strict
, Centrally planned economies Some former communist countries government control.
Living standards are higher than
LEDCs.
Personal freedom may be limited.
Oil rich countries Saudi Arabia, UAE Rich by income per head but
wealth is usually not distributed
evenly.
LEC Pakistan, Kenya At a lower stage of development.
Less economically developed Lower quality of life.
countries Failed states.
LIC Politically unstable.
Low income countries Large agricultural sector.
LDC Afghanistan, Eritrea, Somalia Very low standards of living.
Least developed countries Perhaps due to conflicts.
Failed states.
Politically unstable.
What are the difficulties of using classifications of development?
- Development is hard to define.
- There is a range of development.
- There is both human and economic development.
GDP: a measure of the output of final goods and services.
Purchasing power parity: a measure of average wealth that takes into account the cost of typical basket
goods.
Informal sector: unofficial forms of employment that are not easily made to government regulation and
taxation. It is usually the employment of those that are poorly educated.
What is GDP? Why is it hard to calculate?
- Widely used to measure national economic wealth, one of the best known measurements of global
prosperity.
- There are numerous earnings that are hard to record e.g. the informal sector and the unemployed.
How is it measured?
- Individual countries agree on the guidelines overseen by the UN to calculate it. There is a weighing
between agriculture and industry. It varies for each country and as a country rapidly develops.
- Figures are verified by the World Bank and IMF.
- The numbers are then converted into dollars to make it comparable.
- PPP is calculated.
Why did Nigeria’s GDP ‘grow overnight’?
- They used an outdated formula created in 1990 that did not account for their ‘Nollywood’, movie
industry and they decreased their agricultural share.
- This meant that their GDP went up by 89% within a year between 2012-2013.
What are urban pull factors? Rural push factors?
Urban pull Rural push