Q1:
a. You manage a risky portfolio with an expected rate of return of 18% and a standard deviation
of 28%. The T-bill rate is 8%.
Your client chooses to invest 70% of a portfolio in your fund and 30% in T-bill money market
fund. What is the expected value and standard deviation of the rate of return on his portfolio?
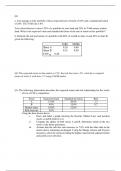
b. Estimate the risk and return of a portfolio with 60% of wealth in share A and 40% in share B,
given the following:
E(Ri) SD(Ri)
Share A 0.20 0.60
Share B 0.15 0.50
COVAB 0.20
Q2: The expected return on the market is 15%, the risk-free rate is 5%, what the is required
return of stock A with beta 1.2? using CAPM model
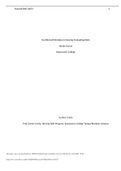
Q3: The following information describes the expected return and risk relationship for the stocks
of two of CM’s competitors:
Stock Expected return Standard deviation Beta
A 12.0% 20.0% 1.3
B 9.0% 15.0% 0.7
Market index 10.0% 12.0%
Risk-free rate 5.0%
Using the data shown above:
i. Draw and label a graph showing the Security Market Line, and position
stocks A and B relative to it.
ii. Compute the alphas of both stocks A and B. Determine which of the two
stocks is the better performer.
iii. Assume that the risk-free rate increases to 7.0% with the other data in the
matrix above remaining unchanged. Using the Sharpe, Jensen and Treynor
measures, select the stock providing the higher expected risk-adjusted return
and justify your selection.
a. You manage a risky portfolio with an expected rate of return of 18% and a standard deviation
of 28%. The T-bill rate is 8%.
Your client chooses to invest 70% of a portfolio in your fund and 30% in T-bill money market
fund. What is the expected value and standard deviation of the rate of return on his portfolio?
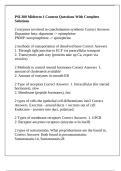
b. Estimate the risk and return of a portfolio with 60% of wealth in share A and 40% in share B,
given the following:
E(Ri) SD(Ri)
Share A 0.20 0.60
Share B 0.15 0.50
COVAB 0.20
Q2: The expected return on the market is 15%, the risk-free rate is 5%, what the is required
return of stock A with beta 1.2? using CAPM model
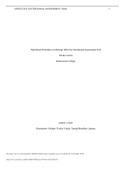
Q3: The following information describes the expected return and risk relationship for the stocks
of two of CM’s competitors:
Stock Expected return Standard deviation Beta
A 12.0% 20.0% 1.3
B 9.0% 15.0% 0.7
Market index 10.0% 12.0%
Risk-free rate 5.0%
Using the data shown above:
i. Draw and label a graph showing the Security Market Line, and position
stocks A and B relative to it.
ii. Compute the alphas of both stocks A and B. Determine which of the two
stocks is the better performer.
iii. Assume that the risk-free rate increases to 7.0% with the other data in the
matrix above remaining unchanged. Using the Sharpe, Jensen and Treynor
measures, select the stock providing the higher expected risk-adjusted return
and justify your selection.