Introduction to Linear Functions
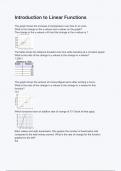
The graph shows the increase in temperature over time in an oven.
What is the change in the y-values and x-values on the graph?
The change in the y-values is 40 and the change in the x-values is 1.
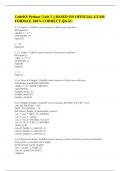
The table shows the distance traveled over time while traveling at a constant speed.
What is the ratio of the change in y-values to the change in x-values?
1,200:1
Skip Ad
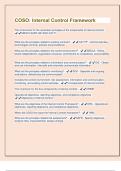
The graph shows the amount of money Miguel earns after working x hours.
What is the ratio of the change in y-values to the change in x-values for this
function?
13:1
Which functions have an additive rate of change of 3? Check all that apply.
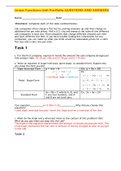
Ellen makes and sells bookmarks. She graphs the number of bookmarks sold
compared to the total money earned. What is the rate of change for the function
graphed to the left?
5/2
The graph shows the increase in temperature over time in an oven.
What is the change in the y-values and x-values on the graph?
The change in the y-values is 40 and the change in the x-values is 1.
The table shows the distance traveled over time while traveling at a constant speed.
What is the ratio of the change in y-values to the change in x-values?
1,200:1
Skip Ad
The graph shows the amount of money Miguel earns after working x hours.
What is the ratio of the change in y-values to the change in x-values for this
function?
13:1
Which functions have an additive rate of change of 3? Check all that apply.
Ellen makes and sells bookmarks. She graphs the number of bookmarks sold
compared to the total money earned. What is the rate of change for the function
graphed to the left?
5/2