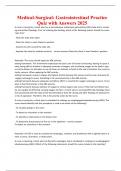
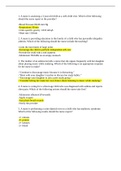
A Second Course in Sta�s�cs Regression Analysis 8e William Mendenhall, Terry Sincich (Solu�ons Manual All Chapters, 100% Original Verified, A+ Grade) Chapter 1 1-1 Copyright © 2020 Pearson Education, Inc. A Review of Basic Concepts (Optional) 1.1 a. High school GPA is a number usually between 0.0 and 4.0. Therefore, it is quantitative. b. Country of citizenship: USA, Japan, etc. is qualitative. c. The scores on the SAT's are numbers between 200 and 800. T herefore, it is quantitative. d. Gender is either male or fe male. Therefore, it is qualitat ive. e. Parent's income is a num ber: $25,000, $45,000, etc. There fore, it is quantitative. f. Age is a number: 17, 18, e tc. Therefore, it is quantitati ve. 1.2 a. The experimental units a re the new automobiles. The mo del name, manufacturer, type of transmission, engine size, numbe r of cylinders, estimated city miles/gallon, and estimated highway miles/gallon are measured on each automobile. b. Model name, manufacturer, and type of transmission are qua litative. None of these is measured on a numerical scale. E ngine size, number of cylinders , estimated city miles/gallon, and estimated highway miles/gallon are all quanti tative. Each of these variables is measured on a numerical scale. 1.3 Both the variables current position and type of organizatio n are qualitative. The variable years of experience is quantitative because it is measured on a numerica l scale. 1.4 The experimental units are the operational satellites curre ntly in orbit around Earth. The variables country of operator/ow ner, primary use, and class of orbit are all qualitative because none are measured on a numerical scale. The variables longitud inal position, apogee, launch mass, usable electric power, and expected lifetime are all quan titative variables. All of these variables are measured on a numerical scale. 1.5 a. Species of sea buckthorn is a qualitative variable. b. Altitude of collection locati on is a quantitative variable. c. Total flavonoid content in b erries is a quantitative variab le. 1.6 Gender and level of educa tion are both qualitative since n either is measured on a numerical scale. Age, income, job satisfaction score, and Machiavellian rating s core are all quantitative since they can be measured on a numerical scale. 1.7 a. The population of interest is all decision makers. The sample set is 155 volunteer students. Variables measured were the emotional state and whether to repa ir a very old car (yes or no). b. Subjects in the guilty-state group are less likely to repai r an old car. Chapter 1 1-2 A Review of Basic Concepts Copyright © 2020 Pearson Education, Inc. 1.8 a. The data would represent the population. These data are all of the data that are of interest to the researchers. b. If the 80 jamming attacks are actually a sample, then the p opulation would be all jamming attacks by the U.S. military over the past several years. 1.9 a. The experimental units are the participants in the study . b. The variables of interest are the price of the engagement r ing and the level of appreciation. The price of the ring is quantita tive, while the level of appre ciation is qualitative. c. The population of interest i s average American engaged coup les. d. The sample of 33 respondent s is probably not representative of the population. Only engaged couples who used a popul ar website for engaged couples were used. Those who used this website were probably not representative of all avera ge American engaged couples. 1.10 a. The sample is the set of 505 teenagers selected at ra ndom from all U.S. teenagers. b. The population from which the sample was selected is the s et of all teenagers in the U.S. c. Since the sample was a ran dom sample, it should be represe ntative of the population. d. The variable of interest is the topics that teenagers most want to discuss with their parents. e. The inference is expressed as a percent of the population that want to discuss particular topics with their parents. f. The “margin of error” is the measure of reliability. This margin of error measures the uncertainty of the inference. 1.11 a. The population of inter est is all young women who recen tly participated in a STEM program. b. The sample is the 159 young women who were recruited to com plete an online survey. c. We would infer that 27% of all young women who recently par ticipated in a STEM program felt that participation in the STEM program increased their int erest in science. 1.12 a. The population of interest is the Machiavellian trait s in accountants. b. The sample is 198 accounting alumni of a large southwester n university. c. The Machiavellian behavior is not necessary to achieve suc cess in the accounting profession. d. Non-response could bias the results by not including poten tial other important information that could direct the researcher to a conclusion. Chapter 1 1-3 Copyright © 2020 Pearson Education, Inc. 1.13 a. A relative frequency table is: Rhino Species Frequency Relative Frequency African Black 5,000 0.1745 African White 20,000 0.6978 (Asian) Sumatran 100 0.0035 (Asian) Javan 60 0.0021 (Asian) Greater One-Horned 3,500 0.1221 Total 28,660 1.000 b. Using MINITAB, the relat ive frequency bar graph is: Greater 1-horned Javan Sumatran White Black0.7
0.6
0.5
0.4
0.3
0.2
0.1
0.0
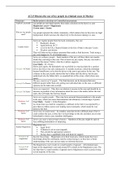
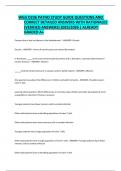
SpeciesRel FreqChart of Rel Freq c. The proportion of African rhinos is 0.1745 0.6978 0.8723. The proportion of Asian rhinos is 0.0035 0.0021 0.1221 0.1277. d. Using MINITAB, the pie chart for these proportions is: African
AsianCategory
12.8%Asian
87.2%AfricanPie Chart of Species
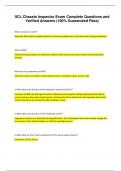
0.6
0.5
0.4
0.3
0.2
0.1
0.0
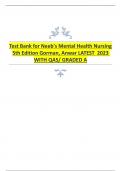
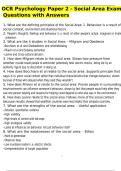
SpeciesRel FreqChart of Rel Freq c. The proportion of African rhinos is 0.1745 0.6978 0.8723. The proportion of Asian rhinos is 0.0035 0.0021 0.1221 0.1277. d. Using MINITAB, the pie chart for these proportions is: African
AsianCategory
12.8%Asian
87.2%AfricanPie Chart of Species