IELTS WRITING (TASK 1)
1)
(GRAPHS
(GRAPHS,TABLES
,TABLES,DIAGRAMS
,DIAGRAMS,CHARTS
,CHARTS & FIGURES
FIGURES = 54
54 samples)
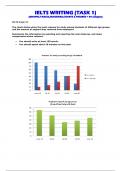
IELTS Graph #1
The charts below show the main reasons for study among students of different age groups
and the amount of support they received from employers.
Summarise the information by selecting and reporting the main features, and make
comparisons where relevant.
• You should write at least 150 words.
• You should spend about 20 minutes on this task.
,model answer:
The first graph shows that there is a gradual decrease in study for career reasons with age. Nearly
80% of students under 26 years, study for their career. This percentage gradually declines by 10-20%
every decade. Only 40% of 40-49yr olds and 18% of over 49yr olds studing for career reasons in late
adulthood.
Conversely, the first graph also shows that study stemming from interest increases with age. There are
only 10% of under 26yr olds studing out of interest. The percentage increases slowly till the beginning
of the fourth decade, and increases dramatically in late adulthood. Nearly same number of 40-49yr
olds study for career and interest. However 70% of over 49yr olds study for interest in comparison to
18% studing for career reasons in that age group.
The second graph shows that employer support is maximum (approximately 60%) for the under 26yr
students. It drops rapidly to 32% up to the third decade of life, and then increses in late adulthood up
to about 44%. It is unclear whether employer support is only for career-focused study, but the highest
level is for those students who mainly study for career purposes.
This is an answer written by a candidate who achieved a Band 8 score. Here is the examiner's
comment:
This answer summarises the key features of both charts and integrates them well. Clear trends are
identified and supported with appropriately-selected figures. The answer could only be improved by
adding an introduction to the general topic of the charts.
The information is well organised, with a clearly-signalled progression. Linking words are used
accurately and precisely, although there is occasional omission. Paragraphing is used well initially, but
lapses in the later section.
A very good range of vocabulary is used to convey the information concisely and accurately with only
occasional inappropriacy. Words are used precisely and there are no errors in spelling or word form.
A wide range of structures is used and most sentences in this answer are accurate. Errors are rare and
do not affect communication in this answer
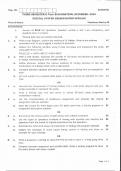
,IELTS Graph #2
You should spend about 20 minutes on this task.
The graph and table below give information about water use worldwide and water consumption in two
different countries.
Summarise the information by selecting and reporting the main features, and make comparisons where
relevant.
Write at least 150 words.
model answer:
The graph shows how the amount of water used worldwide changed between 1900 and 2000.
Throughout the century, the largest quantity of water was used for agricultural Purposes, and this increased
dramatically from about 500 km³ to around 3,000 km³ in the year 2000. Water used in the industrial and domestic
sectors also increased, but consumption was minimal until mid-century. From 1950 onwards, industrial use grew
steadily to just over 1,000 km³, while domestic use rose more slowly to only 300 km³, both far below the levels of
consumption by agriculture.
The table illustrates the differences in agriculture consumption in some areas of the world by contrasting the amount
of irrigated land in Brazil (26,500 km³) with that in the D.R.C. (100 km²). This means that a huge amount of water is
used in agriculture in Brazil, and this is reflected in the figures for water consumption per person: 359 m³ compared
with only 8 m³ in the Congo. With a population of 176 million, the figures for Brazil indicate how high agriculture water
consumption can be in some countries.
(180 words)
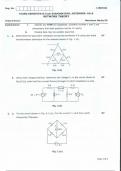
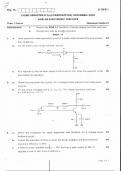
, IELTS Graph #3
You should spend about 20 minutes on this task.
The diagram below shows how a central heating system in a house works.
Summarise the information by selecting and reporting the main features, and make comparisons where
relevant.
You should write at least 150 words.
:
SAMPLE ANSWER :
This diagram provides an overview of a domestic central heating system. It shows how the tank, boiler and pipes
ensure a constant flow of hot water to both the radiators and the taps.
The cold water enters the house and is stored in a water storage tank in the roof. From there ü flows down to the
boiler, located on the ground floor of the house.
The boiler, which is fuelled by gas or oil, heats up the water as it passes through it. The hot water is then pumped
round the house through a system of pipes and flows into the radiators, located in different rooms. The water
circulates through the radiators, which have small tubes inside them to help distribute the heat, and this warms each
of the rooms. Some of the water is directed to the taps to provide hot water for the house.
Once the water has been through the pipes and radiators, it is returned to the boiler to be re-heated and circulated
round the house again.
Introduction: First sentence. Overview: Second sentence.
Key features: Entry of cold water into boiler; circulation of hot waterto radiators and taps; return of waterto boiler.
Supporting information: direction of flow; types of boiler; location of radiators; radiator tubes
Paragraph breaks: The paragraph breaks mark stages in the process.
Linkers: and, from there, then, once, again Reference words: it, both, there, which, this
Topic vocabulary: enters, stored, roof, flows, ground floor, located, passes, pumped, system, circulates, heat, directed, returned,
re-heated
Less common vocabulary: ensure, fuelled by, heats up, distribute the heat, warms
Structures: An appropriate mix of active and passive structures and a range of sentence types are used.
Length: 172 words
1)
(GRAPHS
(GRAPHS,TABLES
,TABLES,DIAGRAMS
,DIAGRAMS,CHARTS
,CHARTS & FIGURES
FIGURES = 54
54 samples)
IELTS Graph #1
The charts below show the main reasons for study among students of different age groups
and the amount of support they received from employers.
Summarise the information by selecting and reporting the main features, and make
comparisons where relevant.
• You should write at least 150 words.
• You should spend about 20 minutes on this task.
,model answer:
The first graph shows that there is a gradual decrease in study for career reasons with age. Nearly
80% of students under 26 years, study for their career. This percentage gradually declines by 10-20%
every decade. Only 40% of 40-49yr olds and 18% of over 49yr olds studing for career reasons in late
adulthood.
Conversely, the first graph also shows that study stemming from interest increases with age. There are
only 10% of under 26yr olds studing out of interest. The percentage increases slowly till the beginning
of the fourth decade, and increases dramatically in late adulthood. Nearly same number of 40-49yr
olds study for career and interest. However 70% of over 49yr olds study for interest in comparison to
18% studing for career reasons in that age group.
The second graph shows that employer support is maximum (approximately 60%) for the under 26yr
students. It drops rapidly to 32% up to the third decade of life, and then increses in late adulthood up
to about 44%. It is unclear whether employer support is only for career-focused study, but the highest
level is for those students who mainly study for career purposes.
This is an answer written by a candidate who achieved a Band 8 score. Here is the examiner's
comment:
This answer summarises the key features of both charts and integrates them well. Clear trends are
identified and supported with appropriately-selected figures. The answer could only be improved by
adding an introduction to the general topic of the charts.
The information is well organised, with a clearly-signalled progression. Linking words are used
accurately and precisely, although there is occasional omission. Paragraphing is used well initially, but
lapses in the later section.
A very good range of vocabulary is used to convey the information concisely and accurately with only
occasional inappropriacy. Words are used precisely and there are no errors in spelling or word form.
A wide range of structures is used and most sentences in this answer are accurate. Errors are rare and
do not affect communication in this answer
,IELTS Graph #2
You should spend about 20 minutes on this task.
The graph and table below give information about water use worldwide and water consumption in two
different countries.
Summarise the information by selecting and reporting the main features, and make comparisons where
relevant.
Write at least 150 words.
model answer:
The graph shows how the amount of water used worldwide changed between 1900 and 2000.
Throughout the century, the largest quantity of water was used for agricultural Purposes, and this increased
dramatically from about 500 km³ to around 3,000 km³ in the year 2000. Water used in the industrial and domestic
sectors also increased, but consumption was minimal until mid-century. From 1950 onwards, industrial use grew
steadily to just over 1,000 km³, while domestic use rose more slowly to only 300 km³, both far below the levels of
consumption by agriculture.
The table illustrates the differences in agriculture consumption in some areas of the world by contrasting the amount
of irrigated land in Brazil (26,500 km³) with that in the D.R.C. (100 km²). This means that a huge amount of water is
used in agriculture in Brazil, and this is reflected in the figures for water consumption per person: 359 m³ compared
with only 8 m³ in the Congo. With a population of 176 million, the figures for Brazil indicate how high agriculture water
consumption can be in some countries.
(180 words)
, IELTS Graph #3
You should spend about 20 minutes on this task.
The diagram below shows how a central heating system in a house works.
Summarise the information by selecting and reporting the main features, and make comparisons where
relevant.
You should write at least 150 words.
:
SAMPLE ANSWER :
This diagram provides an overview of a domestic central heating system. It shows how the tank, boiler and pipes
ensure a constant flow of hot water to both the radiators and the taps.
The cold water enters the house and is stored in a water storage tank in the roof. From there ü flows down to the
boiler, located on the ground floor of the house.
The boiler, which is fuelled by gas or oil, heats up the water as it passes through it. The hot water is then pumped
round the house through a system of pipes and flows into the radiators, located in different rooms. The water
circulates through the radiators, which have small tubes inside them to help distribute the heat, and this warms each
of the rooms. Some of the water is directed to the taps to provide hot water for the house.
Once the water has been through the pipes and radiators, it is returned to the boiler to be re-heated and circulated
round the house again.
Introduction: First sentence. Overview: Second sentence.
Key features: Entry of cold water into boiler; circulation of hot waterto radiators and taps; return of waterto boiler.
Supporting information: direction of flow; types of boiler; location of radiators; radiator tubes
Paragraph breaks: The paragraph breaks mark stages in the process.
Linkers: and, from there, then, once, again Reference words: it, both, there, which, this
Topic vocabulary: enters, stored, roof, flows, ground floor, located, passes, pumped, system, circulates, heat, directed, returned,
re-heated
Less common vocabulary: ensure, fuelled by, heats up, distribute the heat, warms
Structures: An appropriate mix of active and passive structures and a range of sentence types are used.
Length: 172 words