Video 1
Statistics: collecting, classifying, summarizing, organizing, analysing and interpreting numerical
information.
A means to answer research questions and to test hypothesis adequately.
Descriptive: describing a phenomenon or relationship (static/dynamic)
Explanatory: explaining a phenomenon or relationship (static/dynamic)
Signal words descriptive questions: related, correlated, difference or just characteristics not related
with each other
Signal words explanatory questions determines, has an affect or influences
Statistics is about working with numerical information in order to answer research questions and to test
hypotheses
Video 2
Measurement levels of variables:
Categorical variables: variables that contain categories to distinguish different scores
Continuous variables: variables that include different scores, but can take any score on the scale
(there is always a new subdivision possible)
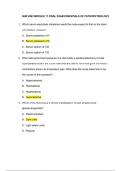
Both of these covers together four categories of measurement levels:
1
,Collection and analysis of data
You organize the data in a data-matrix: this is the starting point for all further analysis. All information
that can be analysed is stored in here.
Video 3
Describing data: can be described using three characteristics:
1. Central Tendency (centre – where is the midpoint of a variable (low/high in the scale))
2. Dispersion (variability – how are the scores spread around that midpoint (widely/closer))
3. Shape (what does the distribution of scores look like (symmetric/skewed))
Central tendency
Not all variables can be described in terms of these three characteristics, the applicability depends on
the measurement level of the variable (nominal, ordinal, interval, ratio).
The most basic way of describing data is by using a frequency table (can be used for all variables of
all measurement levels)
However, it might not be very useful or informative to present and describe a frequency table for
variables with a lot of categories (income measured in absolute euros)
Frequencies: is about counting the numbers of times a certain score appears in your data.
Central tendency: is frequencies in de form of percentages.
2
,There are three common measures of central tendency, the mode, the median and the mean.
- The mode is discord and occurs most frequently. This measure can easily be found by just
looking at the frequency table.
- Median is the middle score of a variable where the scores are ranked from low to high. This
measure is not very sensitive or extreme scores on the lower upper part of the scale.
Otherwise stated, the outcome for the median is less affected by a skewed variable.
- The third one is the mean, that is the average score of scores determined by summing up all
the scores and divided by the number of observations. The mean is sensitive for extreme
scores on one part of the scale, when the variable is skewed. If that is the case, the median
might be a better option to describe the central variable.
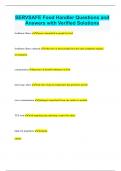
In general, the measures for lower-level variables can be used for higher level variables as well. But
not the other way around (so there is a hierarchy involved)
You can use the mode for any measurement level (nominal, ordinal, interval and ratio)
You can use the median only for three measurement levels (ordinal, interval and ratio)
You can use the mean only for measurement level (interval and ratio)
Apart from the measurement level of the variables, sometimes a measure for central tendency for a
lower measurement level is more adequate because of other reasons like the shape of your
distribution.
In summary
- There are three common measures of central tendency:
1. Mode
2. Median
3. Mean
- Choice of measures for central tendency depends on the measurement level of the variable.
- Measurement levels and measures for central tendency are hierarchical
Video 4
Dispersion
Measures of dispersion refers to how the scores are spread around the centre of a variable. These
measures are only useful when the scores of a variable range from low to high (this means that
measures of dispersion are only useful for variables of ordinal, interval or ratio measurement level)
Dispersion refers to how the scores on the variable are spread around the centre.
There are three common measures of dispersion.
- First, there is the range. This is a very basic measure of variability. To determine the range,
you subtract the lowest score from the highest score. Therefore, it only says what the range is
between the lowest and the highest observed scores.
- The second measure of dispersion is the inter quartile range (IQR). The IQR relates to the
median and refers to the highest and lowest scores in which the middle 50% of the
3
, observations is located. So, the median is the midst observation and the IQR is the range that
includes 25% of the observations above the median and 25% of the observations below the
median. Adding up both parts gives you the middle 50% of the observations. The IQR is the
distance or range of scores between Qu (that is the upper quartile or 75th percentile) and Ql
(the lower quartile or the 25th percentile). The median is the middle quartile or the 50th
percentile score. The bigger or smaller the IQR, the more widely or closely the observations
are spread around the median.
- The third measure of dispersion is the standard deviation. The standard deviation relates to
the mean and refers to the mean differences between the scores and the mean. Standard
deviation is calculated from the variants and when calculated from sample data, which is most
often the case, denoted with the symbol S.
(n= total number of observations)
The standard deviation tells you how close or widely the observations are spread around the mean.
The higher your standard deviation, the more widely the observations are spread.
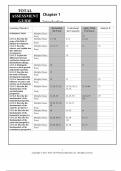
In general, the measures for lower-level variables can be used for higher level variables as well. But
not the other way around (so there is a hierarchy involved)
You can use the range for three measurement levels (ordinal, interval and ratio)
You can use the IQR for three measurement levels (ordinal, interval and ratio)
You can use the Stand deviation only for two measurement levels (interval and ratio)
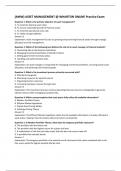
To calculate the standard deviation, you must subtract the mean from all the observed scores, square
the difference and add them all up.
S= √(score-mean)^2 + (score-mean)^2 etc… / total amount of scores – 1
4
Statistics: collecting, classifying, summarizing, organizing, analysing and interpreting numerical
information.
A means to answer research questions and to test hypothesis adequately.
Descriptive: describing a phenomenon or relationship (static/dynamic)
Explanatory: explaining a phenomenon or relationship (static/dynamic)
Signal words descriptive questions: related, correlated, difference or just characteristics not related
with each other
Signal words explanatory questions determines, has an affect or influences
Statistics is about working with numerical information in order to answer research questions and to test
hypotheses
Video 2
Measurement levels of variables:
Categorical variables: variables that contain categories to distinguish different scores
Continuous variables: variables that include different scores, but can take any score on the scale
(there is always a new subdivision possible)
Both of these covers together four categories of measurement levels:
1
,Collection and analysis of data
You organize the data in a data-matrix: this is the starting point for all further analysis. All information
that can be analysed is stored in here.
Video 3
Describing data: can be described using three characteristics:
1. Central Tendency (centre – where is the midpoint of a variable (low/high in the scale))
2. Dispersion (variability – how are the scores spread around that midpoint (widely/closer))
3. Shape (what does the distribution of scores look like (symmetric/skewed))
Central tendency
Not all variables can be described in terms of these three characteristics, the applicability depends on
the measurement level of the variable (nominal, ordinal, interval, ratio).
The most basic way of describing data is by using a frequency table (can be used for all variables of
all measurement levels)
However, it might not be very useful or informative to present and describe a frequency table for
variables with a lot of categories (income measured in absolute euros)
Frequencies: is about counting the numbers of times a certain score appears in your data.
Central tendency: is frequencies in de form of percentages.
2
,There are three common measures of central tendency, the mode, the median and the mean.
- The mode is discord and occurs most frequently. This measure can easily be found by just
looking at the frequency table.
- Median is the middle score of a variable where the scores are ranked from low to high. This
measure is not very sensitive or extreme scores on the lower upper part of the scale.
Otherwise stated, the outcome for the median is less affected by a skewed variable.
- The third one is the mean, that is the average score of scores determined by summing up all
the scores and divided by the number of observations. The mean is sensitive for extreme
scores on one part of the scale, when the variable is skewed. If that is the case, the median
might be a better option to describe the central variable.
In general, the measures for lower-level variables can be used for higher level variables as well. But
not the other way around (so there is a hierarchy involved)
You can use the mode for any measurement level (nominal, ordinal, interval and ratio)
You can use the median only for three measurement levels (ordinal, interval and ratio)
You can use the mean only for measurement level (interval and ratio)
Apart from the measurement level of the variables, sometimes a measure for central tendency for a
lower measurement level is more adequate because of other reasons like the shape of your
distribution.
In summary
- There are three common measures of central tendency:
1. Mode
2. Median
3. Mean
- Choice of measures for central tendency depends on the measurement level of the variable.
- Measurement levels and measures for central tendency are hierarchical
Video 4
Dispersion
Measures of dispersion refers to how the scores are spread around the centre of a variable. These
measures are only useful when the scores of a variable range from low to high (this means that
measures of dispersion are only useful for variables of ordinal, interval or ratio measurement level)
Dispersion refers to how the scores on the variable are spread around the centre.
There are three common measures of dispersion.
- First, there is the range. This is a very basic measure of variability. To determine the range,
you subtract the lowest score from the highest score. Therefore, it only says what the range is
between the lowest and the highest observed scores.
- The second measure of dispersion is the inter quartile range (IQR). The IQR relates to the
median and refers to the highest and lowest scores in which the middle 50% of the
3
, observations is located. So, the median is the midst observation and the IQR is the range that
includes 25% of the observations above the median and 25% of the observations below the
median. Adding up both parts gives you the middle 50% of the observations. The IQR is the
distance or range of scores between Qu (that is the upper quartile or 75th percentile) and Ql
(the lower quartile or the 25th percentile). The median is the middle quartile or the 50th
percentile score. The bigger or smaller the IQR, the more widely or closely the observations
are spread around the median.
- The third measure of dispersion is the standard deviation. The standard deviation relates to
the mean and refers to the mean differences between the scores and the mean. Standard
deviation is calculated from the variants and when calculated from sample data, which is most
often the case, denoted with the symbol S.
(n= total number of observations)
The standard deviation tells you how close or widely the observations are spread around the mean.
The higher your standard deviation, the more widely the observations are spread.
In general, the measures for lower-level variables can be used for higher level variables as well. But
not the other way around (so there is a hierarchy involved)
You can use the range for three measurement levels (ordinal, interval and ratio)
You can use the IQR for three measurement levels (ordinal, interval and ratio)
You can use the Stand deviation only for two measurement levels (interval and ratio)
To calculate the standard deviation, you must subtract the mean from all the observed scores, square
the difference and add them all up.
S= √(score-mean)^2 + (score-mean)^2 etc… / total amount of scores – 1
4