Chapter 5 – Pairs of Variables
5.1 : Scatter plot, covariance and correlation
Dependent variable (usually Y) = topic of investigation
Independent variable (usually X) = cause of variation
Scatterplot -> used to get a visual idea of the relationship between two (quantitative) variables by
displaying all the (x,y) pairs
Population/Sample cloud = all the dots resulting from the (x,y) pairs
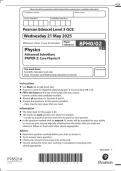
Different possible relationships:
1. Positively linearly related -> best fitting straight line is increasing
2. Negatively linearly related -> best fitting straight line is decreasing
3. Quadratic relationship -> results seem to follow a mountain/valley based parabolic
4. Logarithmic relationship -> results variate wildly for low values but then seem to even out
5. No relationship
Covariance -> measures the degree of linear relationship between y and x
Formula:
N
1
Population covariance: σ X ,Y = ∑ (x −μ )( y −μ y )
N i =1 i x i
n
1
Sample covariance: s X ,Y = ∑ ( x −x )( y i− y )
n−1 i=1 i
-> the reason for ‘n-1’ instead of just ‘n’ in the sample covariance is that it is better at estimating the
population covariance
-> replacing all the y and Y by x and X will result in the formulas for the population variance and the
sample variance
Short cut formula:
N
1
Population covariance: σ X ,Y = ∑ x y −μ μ
N i =1 i i x y
1
Sample covariance: s X ,Y = ¿
n−1
Using the covariance has downsides. A reference point to determine whether the relationship is
strong is missing and the covariance is dependent on the dimensions of the variables
Correlation -> measures the degree of linear relationship between y and x but without the downsides
mentioned above
Formula:
σ X ,Y
Population correlation coefficient: ρ=ρ X , Y =
σ X σY
SX , Y
Sample correlation coefficient: r =r X , Y =
SX SY
-> value of both the coefficients is between (-1,1), where +1 indicates a strong positively linear
,relationship, -1 a strong negatively linear relationship and 0 no relationship (uncorrelated)
5.2 : Regression line
Regression of Y on X = the study of the dependence of Y on X
Least squares (LS) method :
1. Start with a general line with the equation: y = a + bx
2. Fill in the x and find out what values of a and b cause the least overall difference for the y values
Formulas:
S X, Y
Sample regression coefficients: b = 2 and a = y−b x
SX
S X, Y
Population regression coefficients: β 1= 2 and β 0=μ y −β 1 μ x
SX
Sample regression line: ^y =b0 +b1 x (also called: prediction line)
Population regression line: y=β 0 + β 1 x
-> b0/ꟗ0 = the intercept
-> b1/ꟗ1 = the slope
-> sample regression line passes through ( x , y )
-> population regression line passes through ( μ x , μ y )
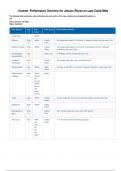
Interpolation = if a new ‘x’ value is within the range of existing ‘x’ values, predictions can be trusted
Extrapolation = if a new ‘x’ value is outside the range of existing ‘x’ values, predictions can’t be
trusted
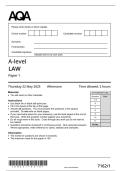
Residuals/Errors = the difference between the y-values and the regression line
-> shows the concentration of y-values around the regression line
-> the sum of residuals will always be 0 (otherwise the regression line is not the best fitting line)
Formulas:
Residual/Error: e i= y i− ^yi
n n
Sum of squared errors: SSE=∑ ( y i− ^y i ) =∑ e i
2 2
i=1 i=1
-> the smaller the SSE, the better the predicting performance of the regression line
5.3 : Linear transformations
Transforming a variable ‘X’ can be done using the formula: Y = a + bX
-> this has implications for certain statistics, summarised below:
Population dataset Sample dataset
Location μ y =a+b μ x y=a+b x
μ ymedian =a+b μ xmedian y median =a+ b x median
2 2 2 2 2 2
Variation σ Y =b σ X sY =b s X
σ Y =|b|σ X sY =|b|s X
, Transforming both variables ‘X’ and ‘Y’ can be using two formulas: V = a + bX and W = c + dY
-> this has implications for certain statistics, summarised below:
Population dataset Sample dataset
Covariance σ V ,W =bd σ X ,Y sV , W =bd s X ,Y
Correlation coefficient If bd >0 : ρV , W = ρX ,Y r V ,W =r X , Y
If bd <0 : ρV , W =− ρX , Y r V ,W =−r X , Y
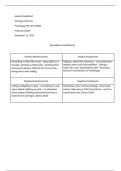
5.4 : Relationship between two qualitative variables
Covariance and correlation coefficient are useless when comparing two qualitative variables
-> instead we use contingency/cross-classification tables, they give the joint frequencies of the data
5.1 : Scatter plot, covariance and correlation
Dependent variable (usually Y) = topic of investigation
Independent variable (usually X) = cause of variation
Scatterplot -> used to get a visual idea of the relationship between two (quantitative) variables by
displaying all the (x,y) pairs
Population/Sample cloud = all the dots resulting from the (x,y) pairs
Different possible relationships:
1. Positively linearly related -> best fitting straight line is increasing
2. Negatively linearly related -> best fitting straight line is decreasing
3. Quadratic relationship -> results seem to follow a mountain/valley based parabolic
4. Logarithmic relationship -> results variate wildly for low values but then seem to even out
5. No relationship
Covariance -> measures the degree of linear relationship between y and x
Formula:
N
1
Population covariance: σ X ,Y = ∑ (x −μ )( y −μ y )
N i =1 i x i
n
1
Sample covariance: s X ,Y = ∑ ( x −x )( y i− y )
n−1 i=1 i
-> the reason for ‘n-1’ instead of just ‘n’ in the sample covariance is that it is better at estimating the
population covariance
-> replacing all the y and Y by x and X will result in the formulas for the population variance and the
sample variance
Short cut formula:
N
1
Population covariance: σ X ,Y = ∑ x y −μ μ
N i =1 i i x y
1
Sample covariance: s X ,Y = ¿
n−1
Using the covariance has downsides. A reference point to determine whether the relationship is
strong is missing and the covariance is dependent on the dimensions of the variables
Correlation -> measures the degree of linear relationship between y and x but without the downsides
mentioned above
Formula:
σ X ,Y
Population correlation coefficient: ρ=ρ X , Y =
σ X σY
SX , Y
Sample correlation coefficient: r =r X , Y =
SX SY
-> value of both the coefficients is between (-1,1), where +1 indicates a strong positively linear
,relationship, -1 a strong negatively linear relationship and 0 no relationship (uncorrelated)
5.2 : Regression line
Regression of Y on X = the study of the dependence of Y on X
Least squares (LS) method :
1. Start with a general line with the equation: y = a + bx
2. Fill in the x and find out what values of a and b cause the least overall difference for the y values
Formulas:
S X, Y
Sample regression coefficients: b = 2 and a = y−b x
SX
S X, Y
Population regression coefficients: β 1= 2 and β 0=μ y −β 1 μ x
SX
Sample regression line: ^y =b0 +b1 x (also called: prediction line)
Population regression line: y=β 0 + β 1 x
-> b0/ꟗ0 = the intercept
-> b1/ꟗ1 = the slope
-> sample regression line passes through ( x , y )
-> population regression line passes through ( μ x , μ y )
Interpolation = if a new ‘x’ value is within the range of existing ‘x’ values, predictions can be trusted
Extrapolation = if a new ‘x’ value is outside the range of existing ‘x’ values, predictions can’t be
trusted
Residuals/Errors = the difference between the y-values and the regression line
-> shows the concentration of y-values around the regression line
-> the sum of residuals will always be 0 (otherwise the regression line is not the best fitting line)
Formulas:
Residual/Error: e i= y i− ^yi
n n
Sum of squared errors: SSE=∑ ( y i− ^y i ) =∑ e i
2 2
i=1 i=1
-> the smaller the SSE, the better the predicting performance of the regression line
5.3 : Linear transformations
Transforming a variable ‘X’ can be done using the formula: Y = a + bX
-> this has implications for certain statistics, summarised below:
Population dataset Sample dataset
Location μ y =a+b μ x y=a+b x
μ ymedian =a+b μ xmedian y median =a+ b x median
2 2 2 2 2 2
Variation σ Y =b σ X sY =b s X
σ Y =|b|σ X sY =|b|s X
, Transforming both variables ‘X’ and ‘Y’ can be using two formulas: V = a + bX and W = c + dY
-> this has implications for certain statistics, summarised below:
Population dataset Sample dataset
Covariance σ V ,W =bd σ X ,Y sV , W =bd s X ,Y
Correlation coefficient If bd >0 : ρV , W = ρX ,Y r V ,W =r X , Y
If bd <0 : ρV , W =− ρX , Y r V ,W =−r X , Y
5.4 : Relationship between two qualitative variables
Covariance and correlation coefficient are useless when comparing two qualitative variables
-> instead we use contingency/cross-classification tables, they give the joint frequencies of the data