Question:
20. Input the data from the table into a spreadsheet. Compute the serial correlation
Answer:
To calculate the serial correlation in decade returns for each asset class and inflation, you can follow
these steps in a spreadsheet:
Explanation:
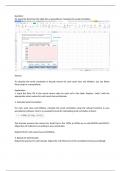
1. Input the Data: Fill in the actual returns data for each cell in the table. Replace "value" with the
appropriate return values for each asset class and decade.
2. Calculate Serial Correlation:
For each asset class and inflation, calculate the serial correlation using the relevant function in your
spreadsheet software. Here's an example formula for calculating serial correlation in Excel:
This formula assumes the returns for Small Cap in the 1930s to 2010s are in cells B2:B10 and B3:B11.
Adjust the cell references according to your actual data.
Repeat this for each asset class and inflation.
3. Repeat for Each Decade:
Repeat the process for each decade. Adjust the cell references in the correlation formula accordingly.
20. Input the data from the table into a spreadsheet. Compute the serial correlation
Answer:
To calculate the serial correlation in decade returns for each asset class and inflation, you can follow
these steps in a spreadsheet:
Explanation:
1. Input the Data: Fill in the actual returns data for each cell in the table. Replace "value" with the
appropriate return values for each asset class and decade.
2. Calculate Serial Correlation:
For each asset class and inflation, calculate the serial correlation using the relevant function in your
spreadsheet software. Here's an example formula for calculating serial correlation in Excel:
This formula assumes the returns for Small Cap in the 1930s to 2010s are in cells B2:B10 and B3:B11.
Adjust the cell references according to your actual data.
Repeat this for each asset class and inflation.
3. Repeat for Each Decade:
Repeat the process for each decade. Adjust the cell references in the correlation formula accordingly.