1
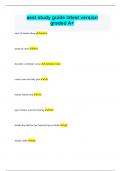
1 Student P and student Q run in a 100 m race.
The diagram shows the distance–time graph for each student during the race.
(a) Determine the time taken for student Q to run 100 m.
time = .............................................. s [1]
(b) Determine the distance between the two students as Q reaches 100 m.
distance = .............................................. m [1]
[Total: 2]
, 2
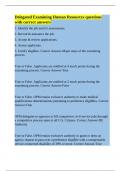
2 Student P and student Q run in a 100 m race.
The diagram shows the distance–time graph for each student during the race.
(a) Calculate the average speed of student Q during the 100 m race.
average speed = .............................................. m / s [3]
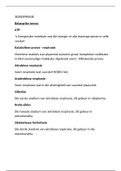
1 Student P and student Q run in a 100 m race.
The diagram shows the distance–time graph for each student during the race.
(a) Determine the time taken for student Q to run 100 m.
time = .............................................. s [1]
(b) Determine the distance between the two students as Q reaches 100 m.
distance = .............................................. m [1]
[Total: 2]
, 2
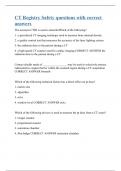
2 Student P and student Q run in a 100 m race.
The diagram shows the distance–time graph for each student during the race.
(a) Calculate the average speed of student Q during the 100 m race.
average speed = .............................................. m / s [3]