Chapter 1
Examining Distributions
1.1 Answers will vary.
1.2 a) Type of wood is categorical. b) Water repellent is categorical. c) Paint thickness is
quantitative. d) Paint color is categorical. e) Weathering time is quantitative.
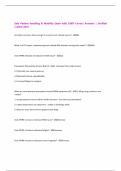
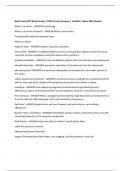
1.3 a) The columns in the chart to the left display nominal data and therefore can be shown in
any order desired. b) No, a pie chart would not be appropriate since the categories do not
make up a whole (or 100%).
Percentage of Undergraduate Majors
35.0%
29.9%
30.0%
25.0%
21.0%
20.0% 17.0%
13.9%
15.0%
10.0% 8.2% 8.5%
5.0%
0.0%
es
g
re
ss
n
gn
in
io
nc
tu
ne
si
er
at
ul
ie
De
ne
si
uc
ic
Sc
Bu
gr
Ed
gi
En
d
A
an
rts
lA
ra
be
Li
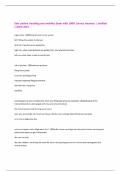
1.4 a)
Occupational Percent
deaths Count of total
Agricultural 659 12%
Mining 152 3%
Construction 1224 21%
Manufacturing 459 8%
Trans and utilities 880 15%
Wholesale 203 4%
Retail 372 7%
Finance 115 2%
Service 1054 18%
Government 526 9%
Other occupations 59 1%
The “other” category represents occupational deaths not found in the 10 specified categories.
This percentage is 1%.
,24 Chapter 1: Examining Distributions
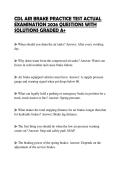
b)
c) We can see that the first three categories, Construction, Transportation and Public Utilities,
and Agricultural deaths, make up 50% of the total occupational deaths in 1999.
,Chapter 1: Examining Distributions 25
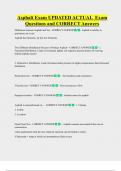
d) Yes, we could use a pie chart to display the data because we know the total number of
occupational deaths.
, 26 Chapter 1: Examining Distributions
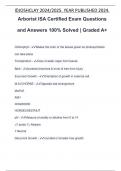
1.5
Examining Distributions
1.1 Answers will vary.
1.2 a) Type of wood is categorical. b) Water repellent is categorical. c) Paint thickness is
quantitative. d) Paint color is categorical. e) Weathering time is quantitative.
1.3 a) The columns in the chart to the left display nominal data and therefore can be shown in
any order desired. b) No, a pie chart would not be appropriate since the categories do not
make up a whole (or 100%).
Percentage of Undergraduate Majors
35.0%
29.9%
30.0%
25.0%
21.0%
20.0% 17.0%
13.9%
15.0%
10.0% 8.2% 8.5%
5.0%
0.0%
es
g
re
ss
n
gn
in
io
nc
tu
ne
si
er
at
ul
ie
De
ne
si
uc
ic
Sc
Bu
gr
Ed
gi
En
d
A
an
rts
lA
ra
be
Li
1.4 a)
Occupational Percent
deaths Count of total
Agricultural 659 12%
Mining 152 3%
Construction 1224 21%
Manufacturing 459 8%
Trans and utilities 880 15%
Wholesale 203 4%
Retail 372 7%
Finance 115 2%
Service 1054 18%
Government 526 9%
Other occupations 59 1%
The “other” category represents occupational deaths not found in the 10 specified categories.
This percentage is 1%.
,24 Chapter 1: Examining Distributions
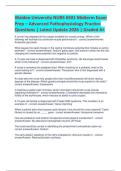
b)
c) We can see that the first three categories, Construction, Transportation and Public Utilities,
and Agricultural deaths, make up 50% of the total occupational deaths in 1999.
,Chapter 1: Examining Distributions 25
d) Yes, we could use a pie chart to display the data because we know the total number of
occupational deaths.
, 26 Chapter 1: Examining Distributions
1.5