gy
iolo
Please check the examination details below before entering your candidate information
2022 xcel B
Candidate surname Other names
Ede
Centre Number Candidate Number
Pearson Edexcel Level 3 GCE
Paper
Time 2 hours 30 minutes
reference 9BI0/03
Biology B
Advanced
PAPER 3: General and Practical Principles in Biology
You must have: Total Marks
Scientific calculator, HB pencil, ruler
Instructions
• Fill
Use black ink or ball-point pen.
• centrein the boxes at the top of this page with your name,
number and candidate number.
• Answer all questions.
• Show your working in any calculation questions and include units in your answer
where appropriate.
• Answer the questions in the spaces provided
– there may be more space than you need.
• In question(s)
You may use a scientific calculator.
• to structure yourmarked with an asterisk (*), marks will be awarded for your ability
answer logically, showing how the points that you make are
related or follow on from each other where appropriate.
Information
• The total mark for this paper is 120.
• The marks for each question are shown in brackets
– use this as a guide as to how much time to spend on each question.
Advice
• Read each question carefully before you start to answer it.
• Try to answer every question.
• your answers if you have time at the end.
Check
Turn over
*P67089RA0140*
P67089RA
©2022 Pearson Education Ltd.
1/1/1/1/1/1/1/1
, gy
iolo
2022 xcel B
Answer ALL questions.
Ede
Write your answers in the spaces provided.
1 Nerve impulses are transmitted along neurones.
(a) (i) In the time period between two nerve impulses, the potential difference
across the membrane is –70 mV.
State the term given to this potential difference.
(1)
. . . . . . . . . . . .. .. .. .. .. .. .. .. .. .. . . . . . . . . . . . . . . . . . . . . . . . . . . . . . . . . . . . . . . . . . . . . . . . . . . . . . . . . . . . . . . . . . . . . . . ........................................................................................................................................... ................ . . . . . . . . . . . . . . . . . . . .
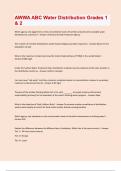
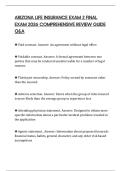
(ii) When the neurone is stimulated, an action potential may occur in the axon,
due to the change in permeability of the membrane to ions.
The graph shows an action potential.
+50
+30
+10
Membrane –10
potential / mV –30
–50
–70
–90
0.5 1.0 1.5 2.0 2.5
Time / ms
Describe what happens in the axon membrane to cause the change in
potential difference between 0.55 ms and 0.80 ms.
(4)
. . . . . . . . . . . .. .. .. .. .. .. .. .. .. .. . . . . . . . . . . . . . . . . . . . . . . . . . . . . . . . . . . . . . . . . . . . . . . . . . . . . . . . . . . . . . . . . . . . . . . ........................................................................................................................................... ................ . . . . . . . . . . . . . . . . . . . .
. . . . . . . . . . . .. .. .. .. .. .. .. .. .. .. . . . . . . . . . . . . . . . . . . . . . . . . . . . . . . . . . . . . . . . . . . . . . . . . . . . . . . . . . . . . . . . . . . . . . . ........................................................................................................................................... ................ . . . . . . . . . . . . . . . . . . . .
. . . . . . . . . . . .. .. .. .. .. .. .. .. .. .. . . . . . . . . . . . . . . . . . . . . . . . . . . . . . . . . . . . . . . . . . . . . . . . . . . . . . . . . . . . . . . . . . . . . . . ........................................................................................................................................... ................ . . . . . . . . . . . . . . . . . . . .
. . . . . . . . . . . .. .. .. .. .. .. .. .. .. .. . . . . . . . . . . . . . . . . . . . . . . . . . . . . . . . . . . . . . . . . . . . . . . . . . . . . . . . . . . . . . . . . . . . . . . ........................................................................................................................................... ................ . . . . . . . . . . . . . . . . . . . .
. . . . . . . . . . . .. .. .. .. .. .. .. .. .. .. . . . . . . . . . . . . . . . . . . . . . . . . . . . . . . . . . . . . . . . . . . . . . . . . . . . . . . . . . . . . . . . . . . . . . . ........................................................................................................................................... ................ . . . . . . . . . . . . . . . . . . . .
. . . . . . . . . . . .. .. .. .. .. .. .. .. .. .. . . . . . . . . . . . . . . . . . . . . . . . . . . . . . . . . . . . . . . . . . . . . . . . . . . . . . . . . . . . . . . . . . . . . . . ........................................................................................................................................... ................ . . . . . . . . . . . . . . . . . . . .
. . . . . . . . . . . .. .. .. .. .. .. .. .. .. .. . . . . . . . . . . . . . . . . . . . . . . . . . . . . . . . . . . . . . . . . . . . . . . . . . . . . . . . . . . . . . . . . . . . . . . ........................................................................................................................................... ................ . . . . . . . . . . . . . . . . . . . .
. . . . . . . . . . . .. .. .. .. .. .. .. .. .. .. . . . . . . . . . . . . . . . . . . . . . . . . . . . . . . . . . . . . . . . . . . . . . . . . . . . . . . . . . . . . . . . . . . . . . . ........................................................................................................................................... ................ . . . . . . . . . . . . . . . . . . . .
. . . . . . . . . . . .. .. .. .. .. .. .. .. .. .. . . . . . . . . . . . . . . . . . . . . . . . . . . . . . . . . . . . . . . . . . . . . . . . . . . . . . . . . . . . . . . . . . . . . . . ........................................................................................................................................... ................ . . . . . . . . . . . . . . . . . . . .
2
*P67089RA0240*
, gy
iolo
2022 xcel B
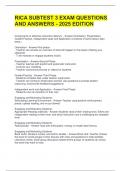
(b) Scientists investigated the effect of stimulating an axon with different voltages
and measured the response.
Ede
The table shows the results of this investigation.
Stimulus voltage / mV Response
25 No action potential
35 No action potential
45 No action potential
55 Action potential
65 Action potential
75 Action potential
Analyse the data to describe the conclusions which can be drawn.
(2)
. . . . . . . . . . . .. .. .. .. .. .. .. .. .. .. . . . . . . . . . . . . . . . . . . . . . . . . . . . . . . . . . . . . . . . . . . . . . . . . . . . . . . . . . . . . . . . . . . . . . . ........................................................................................................................................... ................ . . . . . . . . . . . . . . . . . . . .
. . . . . . . . . . . .. .. .. .. .. .. .. .. .. .. . . . . . . . . . . . . . . . . . . . . . . . . . . . . . . . . . . . . . . . . . . . . . . . . . . . . . . . . . . . . . . . . . . . . . . ........................................................................................................................................... ................ . . . . . . . . . . . . . . . . . . . .
. . . . . . . . . . . .. .. .. .. .. .. .. .. .. .. . . . . . . . . . . . . . . . . . . . . . . . . . . . . . . . . . . . . . . . . . . . . . . . . . . . . . . . . . . . . . . . . . . . . . . ........................................................................................................................................... ................ . . . . . . . . . . . . . . . . . . . .
. . . . . . . . . . . .. .. .. .. .. .. .. .. .. .. . . . . . . . . . . . . . . . . . . . . . . . . . . . . . . . . . . . . . . . . . . . . . . . . . . . . . . . . . . . . . . . . . . . . . . ........................................................................................................................................... ................ . . . . . . . . . . . . . . . . . . . .
. . . . . . . . . . . .. .. .. .. .. .. .. .. .. .. . . . . . . . . . . . . . . . . . . . . . . . . . . . . . . . . . . . . . . . . . . . . . . . . . . . . . . . . . . . . . . . . . . . . . . ........................................................................................................................................... ................ . . . . . . . . . . . . . . . . . . . .
. . . . . . . . . . . .. .. .. .. .. .. .. .. .. .. . . . . . . . . . . . . . . . . . . . . . . . . . . . . . . . . . . . . . . . . . . . . . . . . . . . . . . . . . . . . . . . . . . . . . . ........................................................................................................................................... ................ . . . . . . . . . . . . . . . . . . . .
(Total for Question 1 = 7 marks)
*P67089RA0340*
3
Turn over
, gy
iolo
2022 xcel B
2 A student investigated the number of dividing cells in an onion root tip.
Ede
The student made a root tip squash and counted the number of cells at each stage of
the cell cycle. The table shows the results.
Number of cells at each stage of the cell cycle
Prophase Metaphase Anaphase Telophase Interphase
4 2 1 1 90
(a) (i) Calculate the mitotic index for these results using the formula
number of actively dividing cells
Mitotic index = × 100
total number of cells
(2)
Answer ........................................ . . . . . . . . . . . . . . . . . . . . . .
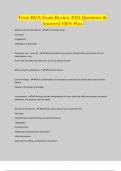
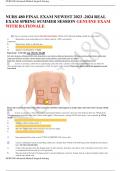
(ii) The mitotic index depends on the distance from the root tip.
The graph shows the relationship between the mitotic index and the distance
from the root tip.
14
12
10
8
Mitotic
index
6
4
2
0
0 0.5 1.0 1.5 2.0
Distance from root tip / mm
4
*P67089RA0440*
iolo
Please check the examination details below before entering your candidate information
2022 xcel B
Candidate surname Other names
Ede
Centre Number Candidate Number
Pearson Edexcel Level 3 GCE
Paper
Time 2 hours 30 minutes
reference 9BI0/03
Biology B
Advanced
PAPER 3: General and Practical Principles in Biology
You must have: Total Marks
Scientific calculator, HB pencil, ruler
Instructions
• Fill
Use black ink or ball-point pen.
• centrein the boxes at the top of this page with your name,
number and candidate number.
• Answer all questions.
• Show your working in any calculation questions and include units in your answer
where appropriate.
• Answer the questions in the spaces provided
– there may be more space than you need.
• In question(s)
You may use a scientific calculator.
• to structure yourmarked with an asterisk (*), marks will be awarded for your ability
answer logically, showing how the points that you make are
related or follow on from each other where appropriate.
Information
• The total mark for this paper is 120.
• The marks for each question are shown in brackets
– use this as a guide as to how much time to spend on each question.
Advice
• Read each question carefully before you start to answer it.
• Try to answer every question.
• your answers if you have time at the end.
Check
Turn over
*P67089RA0140*
P67089RA
©2022 Pearson Education Ltd.
1/1/1/1/1/1/1/1
, gy
iolo
2022 xcel B
Answer ALL questions.
Ede
Write your answers in the spaces provided.
1 Nerve impulses are transmitted along neurones.
(a) (i) In the time period between two nerve impulses, the potential difference
across the membrane is –70 mV.
State the term given to this potential difference.
(1)
. . . . . . . . . . . .. .. .. .. .. .. .. .. .. .. . . . . . . . . . . . . . . . . . . . . . . . . . . . . . . . . . . . . . . . . . . . . . . . . . . . . . . . . . . . . . . . . . . . . . . ........................................................................................................................................... ................ . . . . . . . . . . . . . . . . . . . .
(ii) When the neurone is stimulated, an action potential may occur in the axon,
due to the change in permeability of the membrane to ions.
The graph shows an action potential.
+50
+30
+10
Membrane –10
potential / mV –30
–50
–70
–90
0.5 1.0 1.5 2.0 2.5
Time / ms
Describe what happens in the axon membrane to cause the change in
potential difference between 0.55 ms and 0.80 ms.
(4)
. . . . . . . . . . . .. .. .. .. .. .. .. .. .. .. . . . . . . . . . . . . . . . . . . . . . . . . . . . . . . . . . . . . . . . . . . . . . . . . . . . . . . . . . . . . . . . . . . . . . . ........................................................................................................................................... ................ . . . . . . . . . . . . . . . . . . . .
. . . . . . . . . . . .. .. .. .. .. .. .. .. .. .. . . . . . . . . . . . . . . . . . . . . . . . . . . . . . . . . . . . . . . . . . . . . . . . . . . . . . . . . . . . . . . . . . . . . . . ........................................................................................................................................... ................ . . . . . . . . . . . . . . . . . . . .
. . . . . . . . . . . .. .. .. .. .. .. .. .. .. .. . . . . . . . . . . . . . . . . . . . . . . . . . . . . . . . . . . . . . . . . . . . . . . . . . . . . . . . . . . . . . . . . . . . . . . ........................................................................................................................................... ................ . . . . . . . . . . . . . . . . . . . .
. . . . . . . . . . . .. .. .. .. .. .. .. .. .. .. . . . . . . . . . . . . . . . . . . . . . . . . . . . . . . . . . . . . . . . . . . . . . . . . . . . . . . . . . . . . . . . . . . . . . . ........................................................................................................................................... ................ . . . . . . . . . . . . . . . . . . . .
. . . . . . . . . . . .. .. .. .. .. .. .. .. .. .. . . . . . . . . . . . . . . . . . . . . . . . . . . . . . . . . . . . . . . . . . . . . . . . . . . . . . . . . . . . . . . . . . . . . . . ........................................................................................................................................... ................ . . . . . . . . . . . . . . . . . . . .
. . . . . . . . . . . .. .. .. .. .. .. .. .. .. .. . . . . . . . . . . . . . . . . . . . . . . . . . . . . . . . . . . . . . . . . . . . . . . . . . . . . . . . . . . . . . . . . . . . . . . ........................................................................................................................................... ................ . . . . . . . . . . . . . . . . . . . .
. . . . . . . . . . . .. .. .. .. .. .. .. .. .. .. . . . . . . . . . . . . . . . . . . . . . . . . . . . . . . . . . . . . . . . . . . . . . . . . . . . . . . . . . . . . . . . . . . . . . . ........................................................................................................................................... ................ . . . . . . . . . . . . . . . . . . . .
. . . . . . . . . . . .. .. .. .. .. .. .. .. .. .. . . . . . . . . . . . . . . . . . . . . . . . . . . . . . . . . . . . . . . . . . . . . . . . . . . . . . . . . . . . . . . . . . . . . . . ........................................................................................................................................... ................ . . . . . . . . . . . . . . . . . . . .
. . . . . . . . . . . .. .. .. .. .. .. .. .. .. .. . . . . . . . . . . . . . . . . . . . . . . . . . . . . . . . . . . . . . . . . . . . . . . . . . . . . . . . . . . . . . . . . . . . . . . ........................................................................................................................................... ................ . . . . . . . . . . . . . . . . . . . .
2
*P67089RA0240*
, gy
iolo
2022 xcel B
(b) Scientists investigated the effect of stimulating an axon with different voltages
and measured the response.
Ede
The table shows the results of this investigation.
Stimulus voltage / mV Response
25 No action potential
35 No action potential
45 No action potential
55 Action potential
65 Action potential
75 Action potential
Analyse the data to describe the conclusions which can be drawn.
(2)
. . . . . . . . . . . .. .. .. .. .. .. .. .. .. .. . . . . . . . . . . . . . . . . . . . . . . . . . . . . . . . . . . . . . . . . . . . . . . . . . . . . . . . . . . . . . . . . . . . . . . ........................................................................................................................................... ................ . . . . . . . . . . . . . . . . . . . .
. . . . . . . . . . . .. .. .. .. .. .. .. .. .. .. . . . . . . . . . . . . . . . . . . . . . . . . . . . . . . . . . . . . . . . . . . . . . . . . . . . . . . . . . . . . . . . . . . . . . . ........................................................................................................................................... ................ . . . . . . . . . . . . . . . . . . . .
. . . . . . . . . . . .. .. .. .. .. .. .. .. .. .. . . . . . . . . . . . . . . . . . . . . . . . . . . . . . . . . . . . . . . . . . . . . . . . . . . . . . . . . . . . . . . . . . . . . . . ........................................................................................................................................... ................ . . . . . . . . . . . . . . . . . . . .
. . . . . . . . . . . .. .. .. .. .. .. .. .. .. .. . . . . . . . . . . . . . . . . . . . . . . . . . . . . . . . . . . . . . . . . . . . . . . . . . . . . . . . . . . . . . . . . . . . . . . ........................................................................................................................................... ................ . . . . . . . . . . . . . . . . . . . .
. . . . . . . . . . . .. .. .. .. .. .. .. .. .. .. . . . . . . . . . . . . . . . . . . . . . . . . . . . . . . . . . . . . . . . . . . . . . . . . . . . . . . . . . . . . . . . . . . . . . . ........................................................................................................................................... ................ . . . . . . . . . . . . . . . . . . . .
. . . . . . . . . . . .. .. .. .. .. .. .. .. .. .. . . . . . . . . . . . . . . . . . . . . . . . . . . . . . . . . . . . . . . . . . . . . . . . . . . . . . . . . . . . . . . . . . . . . . . ........................................................................................................................................... ................ . . . . . . . . . . . . . . . . . . . .
(Total for Question 1 = 7 marks)
*P67089RA0340*
3
Turn over
, gy
iolo
2022 xcel B
2 A student investigated the number of dividing cells in an onion root tip.
Ede
The student made a root tip squash and counted the number of cells at each stage of
the cell cycle. The table shows the results.
Number of cells at each stage of the cell cycle
Prophase Metaphase Anaphase Telophase Interphase
4 2 1 1 90
(a) (i) Calculate the mitotic index for these results using the formula
number of actively dividing cells
Mitotic index = × 100
total number of cells
(2)
Answer ........................................ . . . . . . . . . . . . . . . . . . . . . .
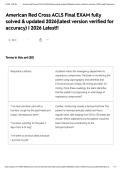
(ii) The mitotic index depends on the distance from the root tip.
The graph shows the relationship between the mitotic index and the distance
from the root tip.
14
12
10
8
Mitotic
index
6
4
2
0
0 0.5 1.0 1.5 2.0
Distance from root tip / mm
4
*P67089RA0440*