LESSON 14
.Marketing strategy
(Marketing: The management process of identifying, anticipating and satisfying customer
demands for profit)
.The product life cycle
- The stages of products go through in their life, from development to withdrawal from
the market.
- As a product evolves and passes through these stages, profit is affected and different
strategies have to be employed to ensure that the product is a success within its
market.
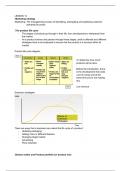
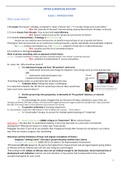
Product life cycle diagram
To determine how much
products will be alive.
Before the introduction, there
is the development that costs
a lot of money and at the
same time you’re not making
any.
Line revenue
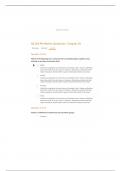
Extension strategies
There are ways that a business can extend the life cycle of a product:
- Updating packaging
- Adding more or different features
- Changing target market
- Advertising
- Price reduction
.Boston matrix and Product portfolio (or product mix)
, PRODUCT PORTFOLIO:
The collection of all the products and services offered by a company.
It made up of product lines (a group of products which are similar), e.g. Televisions are a
product line that include flat screen, HD widescreen and portable televisions.
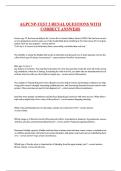
Example:
A business over a particular period of time, aims to launch 3
products. By organising their launch at regular intervals, there
is never a gap in the market.
As one product is declining, another is growing and further
launches are planned.
[This example has just 3 products, but a business may have more products.
It would hope that existing products remain in maturity for a long period, so
that the profit of this mature product would be used to subsidise the launch
of the new ones (New products=costly at first + no profit for the business)]
E.g. Sweet manufacturers (Kit Kat and Nestlè) have successfully managed their product
Portfolio. They are constantly looking to launch new products.
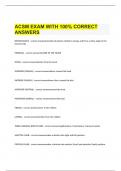
.The Boston Matrix
(Also known as the Product Portfolio Matrix developed by the Boston Consulting Group)
It’s a 2X2 matrix model that analyses a product portfolio according to the growth rate of the
market and the relative market share of products within the market.
Market growth:
- % rate of growth of sales in the market
- Measure of market attractiveness
- From this we derive 4 cells as a means of analysing products.
- How fast is the market for the product growing
Relative market share:
- This is expressed not as a %, but share in relation to other firms in the market
- A measure of the firm’s/product’s strength in the market.
- How strong is the product within the market? Is it a market leader that other product
follow?
- Relative market share can be calculated in terms of revenues or market share. It is
calculated by dividing your own brand's market share (revenues) by the market share
(or revenues) of your largest competitor in that industry.
.Marketing strategy
(Marketing: The management process of identifying, anticipating and satisfying customer
demands for profit)
.The product life cycle
- The stages of products go through in their life, from development to withdrawal from
the market.
- As a product evolves and passes through these stages, profit is affected and different
strategies have to be employed to ensure that the product is a success within its
market.
Product life cycle diagram
To determine how much
products will be alive.
Before the introduction, there
is the development that costs
a lot of money and at the
same time you’re not making
any.
Line revenue
Extension strategies
There are ways that a business can extend the life cycle of a product:
- Updating packaging
- Adding more or different features
- Changing target market
- Advertising
- Price reduction
.Boston matrix and Product portfolio (or product mix)
, PRODUCT PORTFOLIO:
The collection of all the products and services offered by a company.
It made up of product lines (a group of products which are similar), e.g. Televisions are a
product line that include flat screen, HD widescreen and portable televisions.
Example:
A business over a particular period of time, aims to launch 3
products. By organising their launch at regular intervals, there
is never a gap in the market.
As one product is declining, another is growing and further
launches are planned.
[This example has just 3 products, but a business may have more products.
It would hope that existing products remain in maturity for a long period, so
that the profit of this mature product would be used to subsidise the launch
of the new ones (New products=costly at first + no profit for the business)]
E.g. Sweet manufacturers (Kit Kat and Nestlè) have successfully managed their product
Portfolio. They are constantly looking to launch new products.
.The Boston Matrix
(Also known as the Product Portfolio Matrix developed by the Boston Consulting Group)
It’s a 2X2 matrix model that analyses a product portfolio according to the growth rate of the
market and the relative market share of products within the market.
Market growth:
- % rate of growth of sales in the market
- Measure of market attractiveness
- From this we derive 4 cells as a means of analysing products.
- How fast is the market for the product growing
Relative market share:
- This is expressed not as a %, but share in relation to other firms in the market
- A measure of the firm’s/product’s strength in the market.
- How strong is the product within the market? Is it a market leader that other product
follow?
- Relative market share can be calculated in terms of revenues or market share. It is
calculated by dividing your own brand's market share (revenues) by the market share
(or revenues) of your largest competitor in that industry.