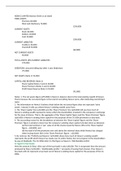
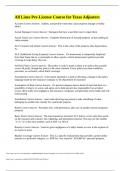
NEWCO LIMITED Balance Sheet as at [date]
FIXED ASSETS
Premises 60,000)
Plant and Machinery 70,000)
(130,000)
CURRENT ASSETS
Stock 40,000)
Debtors 40,000)
Cash 20,000)
(100,000)
CURRENT LIABILITIES
Creditors 10,000)
Overdraft 50,000)
(60,000)
NET CURRENT ASSETS
40,000)
TOTAL ASSETS LESS CURRENT LIABILITIES
170,000)
CREDITORS: amounts falling due after 1 year Debenture
(75,000)
NET ASSETS (Note 1) 95,000)
CAPITAL AND RESERVES (Note 2)
Share Capital (Notes 3 and 4) 40,000
Share Premium (Notes 3 and 4) 20,000
Profit/(Loss) Reserve (Note 5) 35,000
(95,000)
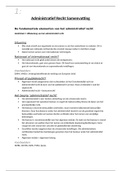
Notes: 1. The net assets figure (£95,000) in Newco’s balance sheet is the total existing wealth of Newco.
That is because the net assets figure is the total of everything Newco owns, after deducting everything it
owes.
2. The information on Newco’s balance sheet below the net assets figure does not represent ‘extra
assets’. Instead, it tells you where Newco’s existing wealth came from.
3. The ‘Share Capital’ line (£40,000) and the ‘Share Premium’ line (£20,000) tell you how much of
Newco’s existing wealth represents money which the shareholders invested in the company in exchange
for the issue of shares. That is, the aggregate of the ‘Share Capital’ figure and the ‘Share Premium’ figure
(£60,000) is Newco’s existing share capital for the purposes of the CA 2006 provisions on buy-back.
4. The accounting reason for the breakdown as between the ‘Share Capital’ figure and the ‘Share
Premium’ figure is simply to show how the company’s existing share capital is broken down as between:
(a) the total nominal or ‘par’ value of all the shares issued by Newco (this is the ‘Share Capital’
figure – £40,000); and
(b) the total of all the premiums over and above the nominal value which Newco has charged
when issuing shares (this is the ‘Share Premium’ figure – £20,000).
5. By contrast, the ‘Profit/(Loss) Reserve’ (£35,000) shows how much of Newco’s existing wealth
represents the profit which Newco has made over its entire history but not yet given to the shareholders
by way of dividends. The CA 2006 refers to this figure as Newco’s ‘distributable profits’.
In regard to buy-backs:
Here the amount in Step 1 (the cost of the buy-back) is only £30,000. This is not greater than the amount
produced by Step 2 (£50,000 = ‘distributable profits’ + proceeds of issuing fresh shares). Thus Newco’s
buy-back will not represent a buy-back out of Newco’s existing share capital for the purposes of the CA
2006.
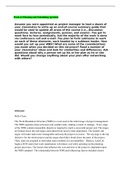
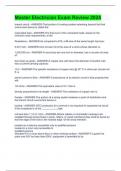
FIXED ASSETS
Premises 60,000)
Plant and Machinery 70,000)
(130,000)
CURRENT ASSETS
Stock 40,000)
Debtors 40,000)
Cash 20,000)
(100,000)
CURRENT LIABILITIES
Creditors 10,000)
Overdraft 50,000)
(60,000)
NET CURRENT ASSETS
40,000)
TOTAL ASSETS LESS CURRENT LIABILITIES
170,000)
CREDITORS: amounts falling due after 1 year Debenture
(75,000)
NET ASSETS (Note 1) 95,000)
CAPITAL AND RESERVES (Note 2)
Share Capital (Notes 3 and 4) 40,000
Share Premium (Notes 3 and 4) 20,000
Profit/(Loss) Reserve (Note 5) 35,000
(95,000)
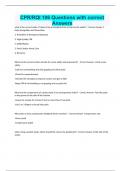
Notes: 1. The net assets figure (£95,000) in Newco’s balance sheet is the total existing wealth of Newco.
That is because the net assets figure is the total of everything Newco owns, after deducting everything it
owes.
2. The information on Newco’s balance sheet below the net assets figure does not represent ‘extra
assets’. Instead, it tells you where Newco’s existing wealth came from.
3. The ‘Share Capital’ line (£40,000) and the ‘Share Premium’ line (£20,000) tell you how much of
Newco’s existing wealth represents money which the shareholders invested in the company in exchange
for the issue of shares. That is, the aggregate of the ‘Share Capital’ figure and the ‘Share Premium’ figure
(£60,000) is Newco’s existing share capital for the purposes of the CA 2006 provisions on buy-back.
4. The accounting reason for the breakdown as between the ‘Share Capital’ figure and the ‘Share
Premium’ figure is simply to show how the company’s existing share capital is broken down as between:
(a) the total nominal or ‘par’ value of all the shares issued by Newco (this is the ‘Share Capital’
figure – £40,000); and
(b) the total of all the premiums over and above the nominal value which Newco has charged
when issuing shares (this is the ‘Share Premium’ figure – £20,000).
5. By contrast, the ‘Profit/(Loss) Reserve’ (£35,000) shows how much of Newco’s existing wealth
represents the profit which Newco has made over its entire history but not yet given to the shareholders
by way of dividends. The CA 2006 refers to this figure as Newco’s ‘distributable profits’.
In regard to buy-backs:
Here the amount in Step 1 (the cost of the buy-back) is only £30,000. This is not greater than the amount
produced by Step 2 (£50,000 = ‘distributable profits’ + proceeds of issuing fresh shares). Thus Newco’s
buy-back will not represent a buy-back out of Newco’s existing share capital for the purposes of the CA
2006.