Data analysis I
, Week 1
Statistics
Statistics as a science studies the collection, interpretation, presentation, and organisation of data. Statistics helps us to understand reality
behind numbers and extract valuable information.
Sample vs Population
Population - represents the complete set of items that interests an investigator (i.e everything dude). Bear in mind that the population is ever
changing and hence it is a dynamic concept. The population size is usually represented by N. E.g entire UK population
Sample - a relatively small selection from the population. We use samples to make interference about the population. The sample size is usually
represented by n. There are different types of sampling:
Simple random sampling
Systematic sampling
Cluster Sampling
Multi-stage Sampling
Descriptive Statistics - using the sample data to describe and draw conclusions about the sample only e.g graphical and numerical procedures.
Descriptive statistics:
- collect data e.g surveys
- present data e.g tables and graphs
- summarise data e.g sample mean Exci
M
Inferential Statistics - using the same,s data to draw conclusions about the population e.g use data to make predictions and or estimates to
assist decision making. Inference is the process of drawing
- estimation e.g estimate population mean body weight using sample mean body weight
- hypothesis testing e.g test the claim that mean population body weight is higher in rural area compared to cities
Simple Random Sampling
Simple random sampling is a procedure in which:
- each member of the population is chosen strict,y by chance
- each member of the population is equally likely to be chosen
- the selection if one member does not influence the selection of any other member
- every possible sample of n objects is equally likely to be chosen
The resulting sample is called a random sample
Data, data sets, observations and variables
Elements - entities on which data are collect
Variable - a characteristic of interest for the elements
Data - facts or figures from which conclusions can be drawn
Data Set - all the data collected in a particular study
Observation - a set of measurements obtained for a particular element
, Parameter vs Statistic
Parameter - a numerical measure that describes a specific characteristic of a population
Statistic - a numerical measure that describes a specific characteristic of a sample
The difference between a parameter and a statistic is called a sampling error. The sampling error results
from the fact that information is available on only a subset (sample) of the population
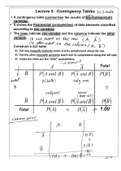
Types of Data
S 19 OR
Categorical
Da
S Data
OR
Numerical
Discrete numerical variables Cross-section data
- they are the result of a counting process - parallel data on several units (e.g individuals) at one point in time
- e.g the number of kids a family has - e.g Consumption data across OECD countries in 2018
Continuous numerical variables Time-series data
- they usually arise from a measurement process - data on one unit at several points of time (yearly, quarterly,
- take any value within a given range monthly, daily)
- values can vary depending on the accuracy of the instrument used - e.g Consumption data for the UK 1960 - 2016 (yearly)
- e.g wages, prices
Panel data
- data on several units at several points in time
- e.g Consumption data across OECD countries 1960 - 2018
, Week 1
Statistics
Statistics as a science studies the collection, interpretation, presentation, and organisation of data. Statistics helps us to understand reality
behind numbers and extract valuable information.
Sample vs Population
Population - represents the complete set of items that interests an investigator (i.e everything dude). Bear in mind that the population is ever
changing and hence it is a dynamic concept. The population size is usually represented by N. E.g entire UK population
Sample - a relatively small selection from the population. We use samples to make interference about the population. The sample size is usually
represented by n. There are different types of sampling:
Simple random sampling
Systematic sampling
Cluster Sampling
Multi-stage Sampling
Descriptive Statistics - using the sample data to describe and draw conclusions about the sample only e.g graphical and numerical procedures.
Descriptive statistics:
- collect data e.g surveys
- present data e.g tables and graphs
- summarise data e.g sample mean Exci
M
Inferential Statistics - using the same,s data to draw conclusions about the population e.g use data to make predictions and or estimates to
assist decision making. Inference is the process of drawing
- estimation e.g estimate population mean body weight using sample mean body weight
- hypothesis testing e.g test the claim that mean population body weight is higher in rural area compared to cities
Simple Random Sampling
Simple random sampling is a procedure in which:
- each member of the population is chosen strict,y by chance
- each member of the population is equally likely to be chosen
- the selection if one member does not influence the selection of any other member
- every possible sample of n objects is equally likely to be chosen
The resulting sample is called a random sample
Data, data sets, observations and variables
Elements - entities on which data are collect
Variable - a characteristic of interest for the elements
Data - facts or figures from which conclusions can be drawn
Data Set - all the data collected in a particular study
Observation - a set of measurements obtained for a particular element
, Parameter vs Statistic
Parameter - a numerical measure that describes a specific characteristic of a population
Statistic - a numerical measure that describes a specific characteristic of a sample
The difference between a parameter and a statistic is called a sampling error. The sampling error results
from the fact that information is available on only a subset (sample) of the population
Types of Data
S 19 OR
Categorical
Da
S Data
OR
Numerical
Discrete numerical variables Cross-section data
- they are the result of a counting process - parallel data on several units (e.g individuals) at one point in time
- e.g the number of kids a family has - e.g Consumption data across OECD countries in 2018
Continuous numerical variables Time-series data
- they usually arise from a measurement process - data on one unit at several points of time (yearly, quarterly,
- take any value within a given range monthly, daily)
- values can vary depending on the accuracy of the instrument used - e.g Consumption data for the UK 1960 - 2016 (yearly)
- e.g wages, prices
Panel data
- data on several units at several points in time
- e.g Consumption data across OECD countries 1960 - 2018