OEFENINGEN OMI II
INTRODUCTIE
OEFENING 1
In je analyses ga je gebruik maken van de volgende variabelen: polintr (var 8), trstpl (var 13) en trstplt (var 16). Rapporteer
over deze variabelen.
Var 8 = ordinaal // Var 13 en 16 = schaal
è Tabellen aanmaken + conclussies trekken
Var 8: via analyze -> descriptive statistics -> frequencies -> invullen -> paste -> selecteren -> run
N %
Very intrested 180 10,2
Quite intrested 609 34,5
Hardly intrested 608 34,4
Not at all intrested 369 20,9
Total 1766 100
Var 13 en 16: via analyze -> descriptive statistics -> descriptives -> invullen -> paste -> selecteren -> run
N Gemiddelde St. afw.
Trust in country’s parliaments 1751 4,79 2,196
Trust in politicans 1755 4,26 2,154
Conclussie: meerderheid nauwelijks of geen interesse in politiek + vertrouwen in parlement logt iets hoger dan vertrouwen in
politici
OEFENING 2
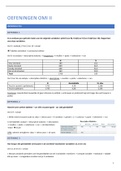
Hoeveel uren werken (wkhtot – var 157) vrouwen (gndr - var 116) gemiddeld?
Var 157 = schaal
I. Willen enkel vrouwen (code 2): data -> select cases -> if condition -> gender = 2 -> continue -> paste -> selecteren -> run
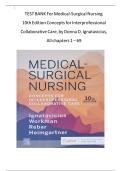
II. Gemiddelde: analyze -> descriptive statistics -> descriptives
-> invullen -> paste -> selecteren -> run -> zie tabel kolom
‘mean’ è 35,92
OPM. selectie verwijderen: data -> select cases -> all cases
OEFENING 3
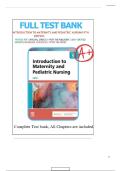
Hoe hoog is het gemiddelde vertrouwen in de overheid? (Combineer variabelen 13, 14 en 15)
Var 13, 14 en 15 = schaal
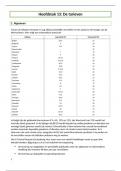
I. Nieuwe variabele aanmaken van het gemiddelde van de 3 variabelen: transform -> compute variable -> statistical -> dubbel
klik op mean -> vraagtekens invullen met je 3 variabelen
1
, II. Gemiddelde vertrouwen bekijken (van je nieuwe
variabele): analyze -> descriptive statistics -> descriptives
-> invullen -> paste -> selecteren -> run -> zie tabel kolom
‘mean’ è 5,57
BIVARIATE ANALYZE
OEFENING 1
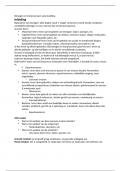
Is er een verband tussen het al dan niet gelovig zijn (rlgblg – var 60) en de mening die men heeft over de uitspraak ‘Gays and
lesbians free to live life as they wish’ (freehms– var 40)
Var 60 = nominaal // Var 40 = ordinaal
è We zoeken een verband tussen nominaal en ordinaal DUS chi-kwadraat toets gebruiken
I. Analyze -> descriptive statistics -> cross-tabs -> invullen -> bij statistics ‘Phi en Cramers V’ aanduiden (om te zeggen hoe sterk
het verband is) + bij cells ‘column’ aanduiden (om percentages te krijgen zodat we richting kunnen bespreken)
II. In tabel ‘chi-square’ checken of alle cellen meer dan 5 elementen hebben è in orde
III. Interpretatie:
ð VRAAG 1: Is er een significant verband? p-waarde < 0,001 < α = 0,05 è H0 verwerpen DUS er is een significant verband
ð VRAAG 2: Hoe sterk is dit verband? Kijken in tabel ‘symmetric measures’ è Cramers V = 0,288 = dichter bij 0 dan bij 1
DUS een zwak verband
ð VRAAG 3: Richting van het verband? Kijken naar kruistabel en zelf interpreteren è Gelovigen zijn conservatiever
OEFENING 2
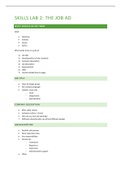
Hoe sterk is het verband tussen de leeftijd (var 117) en de autonomie die men ervaart (var 153 en 154)?
Var 117 = schaal // Var 153 en 154 = schaal
è We zoeken een verband tussen 2 schaal DUS Pearson-correlatie gebruiken
I. Analyze -> correlatie -> bivariate -> invullen + Pearson aanduiden
II. Interpretatie:
• Correlatie tussen leeftijd en organisatieautonomie:
ð VRAAG 1: Is er een verband? p-waarde = 0,060 > α = 0,05 è H0 aanvaarden DUS er is geen significant verband
• Correlatie tussen leeftijd en beslissingsautonomie:
2
INTRODUCTIE
OEFENING 1
In je analyses ga je gebruik maken van de volgende variabelen: polintr (var 8), trstpl (var 13) en trstplt (var 16). Rapporteer
over deze variabelen.
Var 8 = ordinaal // Var 13 en 16 = schaal
è Tabellen aanmaken + conclussies trekken
Var 8: via analyze -> descriptive statistics -> frequencies -> invullen -> paste -> selecteren -> run
N %
Very intrested 180 10,2
Quite intrested 609 34,5
Hardly intrested 608 34,4
Not at all intrested 369 20,9
Total 1766 100
Var 13 en 16: via analyze -> descriptive statistics -> descriptives -> invullen -> paste -> selecteren -> run
N Gemiddelde St. afw.
Trust in country’s parliaments 1751 4,79 2,196
Trust in politicans 1755 4,26 2,154
Conclussie: meerderheid nauwelijks of geen interesse in politiek + vertrouwen in parlement logt iets hoger dan vertrouwen in
politici
OEFENING 2
Hoeveel uren werken (wkhtot – var 157) vrouwen (gndr - var 116) gemiddeld?
Var 157 = schaal
I. Willen enkel vrouwen (code 2): data -> select cases -> if condition -> gender = 2 -> continue -> paste -> selecteren -> run
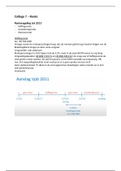
II. Gemiddelde: analyze -> descriptive statistics -> descriptives
-> invullen -> paste -> selecteren -> run -> zie tabel kolom
‘mean’ è 35,92
OPM. selectie verwijderen: data -> select cases -> all cases
OEFENING 3
Hoe hoog is het gemiddelde vertrouwen in de overheid? (Combineer variabelen 13, 14 en 15)
Var 13, 14 en 15 = schaal
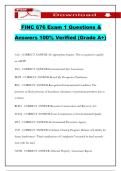
I. Nieuwe variabele aanmaken van het gemiddelde van de 3 variabelen: transform -> compute variable -> statistical -> dubbel
klik op mean -> vraagtekens invullen met je 3 variabelen
1
, II. Gemiddelde vertrouwen bekijken (van je nieuwe
variabele): analyze -> descriptive statistics -> descriptives
-> invullen -> paste -> selecteren -> run -> zie tabel kolom
‘mean’ è 5,57
BIVARIATE ANALYZE
OEFENING 1
Is er een verband tussen het al dan niet gelovig zijn (rlgblg – var 60) en de mening die men heeft over de uitspraak ‘Gays and
lesbians free to live life as they wish’ (freehms– var 40)
Var 60 = nominaal // Var 40 = ordinaal
è We zoeken een verband tussen nominaal en ordinaal DUS chi-kwadraat toets gebruiken
I. Analyze -> descriptive statistics -> cross-tabs -> invullen -> bij statistics ‘Phi en Cramers V’ aanduiden (om te zeggen hoe sterk
het verband is) + bij cells ‘column’ aanduiden (om percentages te krijgen zodat we richting kunnen bespreken)
II. In tabel ‘chi-square’ checken of alle cellen meer dan 5 elementen hebben è in orde
III. Interpretatie:
ð VRAAG 1: Is er een significant verband? p-waarde < 0,001 < α = 0,05 è H0 verwerpen DUS er is een significant verband
ð VRAAG 2: Hoe sterk is dit verband? Kijken in tabel ‘symmetric measures’ è Cramers V = 0,288 = dichter bij 0 dan bij 1
DUS een zwak verband
ð VRAAG 3: Richting van het verband? Kijken naar kruistabel en zelf interpreteren è Gelovigen zijn conservatiever
OEFENING 2
Hoe sterk is het verband tussen de leeftijd (var 117) en de autonomie die men ervaart (var 153 en 154)?
Var 117 = schaal // Var 153 en 154 = schaal
è We zoeken een verband tussen 2 schaal DUS Pearson-correlatie gebruiken
I. Analyze -> correlatie -> bivariate -> invullen + Pearson aanduiden
II. Interpretatie:
• Correlatie tussen leeftijd en organisatieautonomie:
ð VRAAG 1: Is er een verband? p-waarde = 0,060 > α = 0,05 è H0 aanvaarden DUS er is geen significant verband
• Correlatie tussen leeftijd en beslissingsautonomie:
2