Relative Isotopic Mass the mass of an individual atom of an
element compared to 1112th the mass
of a carbon 12 atom
Relative Atomic Mass the weighted mean mass of an atom of
an element compared to 1112th the
mass of a carbon 12 atom
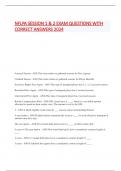
Mass Spectrometry
Graph of relative abundance against MIZ ratio mass to charge
largest ion the molecular in Mt which shows the Ar
highest Miz value
Height of peaks is relative to abundantly
Atoms can use the relative abundances to work out
RAM
Elloabundantly MIZ
100
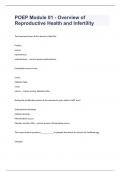
Diatomic Molecules e
g chlorine
3 peaks 70,72 74
A 35 has 75 abunchaney 3 1 heights
A 37 has 25 abundancy
70 2 0135 Prob
34 3
6 35 4 37 C 37 0135 Prob 2
72 or 34 4 4
74 2 11 37 Prob
xt 1
Ionisation Energy
first Ionisation Energy the energy required to remove one
electron from each atom in a mole
of gaseous atoms to form one
mole of H gaseous ions
A g At t e
g
, second to form I mole of 2 gaseous ions
At Azt Cg t e
g
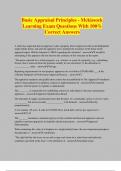
Trends In Ionisation Energies
Down a croup increase in number of shells of é
valence e is further from nucleus
less nuclear attraction
e e repulsion causes more shielding
Ionisation Energy to
despite the P in number of protons the P in
number of shells is more significant
Across a Period More protons electrons
same number of shells
shells pulled in tighter A nuclear charge
distance to
Ionisation Energy T
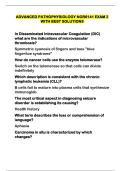
Variation with Atomic Number Periodicity repeatingpatternacrossperiods
Macinium IES at each
noble gas
Minimum IE's at each
group I metal
General T from GPIto8
no of Pt T
atomic radius t
no of shielding e sam
T in nuclear charge
General to from Period I
to 2 to 3
P in number ofshells
next one is lower than
all proceeding ones
Dip at 3rd element from2nd
2s shell filled starts filling 2p
shielding from 2s electrons
I in IE easier to lose e
Dip at 6th element fromSth
removing a paired 2pelectron
easier to remove repulsion from paired e i t in le
element compared to 1112th the mass
of a carbon 12 atom
Relative Atomic Mass the weighted mean mass of an atom of
an element compared to 1112th the
mass of a carbon 12 atom
Mass Spectrometry
Graph of relative abundance against MIZ ratio mass to charge
largest ion the molecular in Mt which shows the Ar
highest Miz value
Height of peaks is relative to abundantly
Atoms can use the relative abundances to work out
RAM
Elloabundantly MIZ
100
Diatomic Molecules e
g chlorine
3 peaks 70,72 74
A 35 has 75 abunchaney 3 1 heights
A 37 has 25 abundancy
70 2 0135 Prob
34 3
6 35 4 37 C 37 0135 Prob 2
72 or 34 4 4
74 2 11 37 Prob
xt 1
Ionisation Energy
first Ionisation Energy the energy required to remove one
electron from each atom in a mole
of gaseous atoms to form one
mole of H gaseous ions
A g At t e
g
, second to form I mole of 2 gaseous ions
At Azt Cg t e
g
Trends In Ionisation Energies
Down a croup increase in number of shells of é
valence e is further from nucleus
less nuclear attraction
e e repulsion causes more shielding
Ionisation Energy to
despite the P in number of protons the P in
number of shells is more significant
Across a Period More protons electrons
same number of shells
shells pulled in tighter A nuclear charge
distance to
Ionisation Energy T
Variation with Atomic Number Periodicity repeatingpatternacrossperiods
Macinium IES at each
noble gas
Minimum IE's at each
group I metal
General T from GPIto8
no of Pt T
atomic radius t
no of shielding e sam
T in nuclear charge
General to from Period I
to 2 to 3
P in number ofshells
next one is lower than
all proceeding ones
Dip at 3rd element from2nd
2s shell filled starts filling 2p
shielding from 2s electrons
I in IE easier to lose e
Dip at 6th element fromSth
removing a paired 2pelectron
easier to remove repulsion from paired e i t in le