LECTURE 1: EXAMINING DATA - Chapters 1 & 2
Types of data
● Nonmetric or qualitative data (presence of a feature): gender, nationality
● Metric or quantitative data (quantifying an attribute): height, satisfaction
Measurement scales
● Qualitative (categorical, discrete) data
○ Nominal scale (numbers in place of labels): female = 0 and male = 1
○ Ordinal scale (ranking): best product, 2nd best product,…, worst product
● Quantitative data
○ Interval scale (no 0 reference point): celsius scales
○ Ratio scale (0 reference point): height in meters
Missing value analysis
Missing data - for an individual we have only partial information; we know
the values of only some of its characteristics
For instance, when a respondent fails to answer one or more questions (intentionally or unintentionally)
Goal of analysis: identify the true patterns and relationships among variables even when some data is
missing - if there is a pattern it means that missing data is not random/unintentional
Impact of missing data:
- Reduces sample size
- Can distort results: is it a systematic or random data deficiency?
Types of missing data:
● Missing Completely At Random (MCAR): for any respondent, the probability that the value of a
variable is missing does not depend on any variable
● Missing At Random (MAR): for any respondent, the probability that the value of a variable is
missing depends on other variables
How to analyze missing data?
Check in each variable
- Percentage of missing values
- Number of extremes and outliers
Check in each observation
- Percentage of missing values
- How often it is an extreme or outlier (also to what extent)
Check how often the missing patterns occur
- Frequent patterns might indicate causality
- Which cases present these missing patterns?
,How to handle missing data?
Ignore
● When there are less than 10% of cases/variables
● When there are no patterns
Deletion
● When there are more than 20% of cases/variables
● Listwise: delete entire observation (case)
○ Advantage: complete remaining dataset
○ Disadvantage: reduced resulting sample size due to the loss of the incomplete cases,
biased dataset (if not MCAR)
● Pairwise: delete incomplete cases on an analysis-by-analysis basis (delete from the calculation)
○ Sample size remains the same for some analysis or reduced for others
○ Disadvantage: inconsistency of the sample size
Imputation
● Mean (of entire data or group): reduces variability
● Hot deck imputation: use an observation from the sample that is considered similar
● Cold deck imputation: use an observation from an external data source that is considered similar
Rules of thumb to handle missing data
< 10% → ignore or use any imputation method
10% - 20% → hot deck imputation (assuming MCAR)
> 20% → deletion
Examining data
Why should we examine the data carefully? To prevent jumping to wrong conclusions
Understand the type of data to answer the following questions:
- What are the characteristics of the data?
- Is there a common behaviour to all data?
- Is there any outlier?
- Which analysis method(s) can we use?
How can we examine data?
We should detect the major features of the probability distribution of the variables
First it is important to identify the type of data and determine what calculation makes sense:
● Examining qualitative data
○ What could make sense to calculate?
■ Frequency table
■ Minimum, maximum
■ Range
■ Mode
○ What graphical techniques can be applied?
■ Pie chart
, ■ Bar chart
● Examining quantitative data - quantitative data allows for more techniques
○ What could make sense to calculate?
■ Mean, mode, median
■ Range, interquartile range
■ Standard deviation, variance
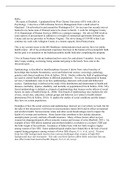
■ Skewness, Kurtosis →
○ What graphical techniques can be applied?
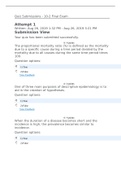
■ Boxplot
■ Scatterplot
■ Histogram
■ Boxplots and histograms present the distribution of a quantitative variable
Quantitative data - what should we do to analyze data
- Detect the major features of the probability distribution of the variables
- The shape of the probability distribution is important →
for the measures of centrality and dispersion of the data
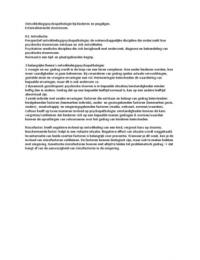
Quantitative data - which central measures(s) are robust to outliers?
- Identifying and removing outliers can be crucial for an analysis
Quantitative data - analyzing relations
- Use graphical methods to investigate relationships
- An alternative could be a crosstabulation
- Important goal: transparency
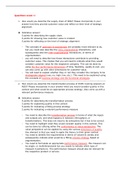
Examining both types of data - you can also visualize the relation
of qualitative and quantitative data at the same time
What can we do with the characteristics of the data?
● Design a correct model reproducing the features of the
data
● Choose an adequate technique for the analysis
○ Is the sample size large enough?
○ Are the assumptions required by the chosen analysis technique satisfied by the data?
○ Do we have all the necessary data to apply correctly the chosen analysis technique?
● Transform the data before studying it if necessary (use logarithms, squares, square roots)
Types of samples
● Independent samples: the groups in the data do not correspond to each other
○ The number of observations in each group can be different
● Matched pairs: the groups in the data correspond to each other
○ The number of observations in each group are always the same
In which case do we have to test for equality of variances?
Types of data
● Nonmetric or qualitative data (presence of a feature): gender, nationality
● Metric or quantitative data (quantifying an attribute): height, satisfaction
Measurement scales
● Qualitative (categorical, discrete) data
○ Nominal scale (numbers in place of labels): female = 0 and male = 1
○ Ordinal scale (ranking): best product, 2nd best product,…, worst product
● Quantitative data
○ Interval scale (no 0 reference point): celsius scales
○ Ratio scale (0 reference point): height in meters
Missing value analysis
Missing data - for an individual we have only partial information; we know
the values of only some of its characteristics
For instance, when a respondent fails to answer one or more questions (intentionally or unintentionally)
Goal of analysis: identify the true patterns and relationships among variables even when some data is
missing - if there is a pattern it means that missing data is not random/unintentional
Impact of missing data:
- Reduces sample size
- Can distort results: is it a systematic or random data deficiency?
Types of missing data:
● Missing Completely At Random (MCAR): for any respondent, the probability that the value of a
variable is missing does not depend on any variable
● Missing At Random (MAR): for any respondent, the probability that the value of a variable is
missing depends on other variables
How to analyze missing data?
Check in each variable
- Percentage of missing values
- Number of extremes and outliers
Check in each observation
- Percentage of missing values
- How often it is an extreme or outlier (also to what extent)
Check how often the missing patterns occur
- Frequent patterns might indicate causality
- Which cases present these missing patterns?
,How to handle missing data?
Ignore
● When there are less than 10% of cases/variables
● When there are no patterns
Deletion
● When there are more than 20% of cases/variables
● Listwise: delete entire observation (case)
○ Advantage: complete remaining dataset
○ Disadvantage: reduced resulting sample size due to the loss of the incomplete cases,
biased dataset (if not MCAR)
● Pairwise: delete incomplete cases on an analysis-by-analysis basis (delete from the calculation)
○ Sample size remains the same for some analysis or reduced for others
○ Disadvantage: inconsistency of the sample size
Imputation
● Mean (of entire data or group): reduces variability
● Hot deck imputation: use an observation from the sample that is considered similar
● Cold deck imputation: use an observation from an external data source that is considered similar
Rules of thumb to handle missing data
< 10% → ignore or use any imputation method
10% - 20% → hot deck imputation (assuming MCAR)
> 20% → deletion
Examining data
Why should we examine the data carefully? To prevent jumping to wrong conclusions
Understand the type of data to answer the following questions:
- What are the characteristics of the data?
- Is there a common behaviour to all data?
- Is there any outlier?
- Which analysis method(s) can we use?
How can we examine data?
We should detect the major features of the probability distribution of the variables
First it is important to identify the type of data and determine what calculation makes sense:
● Examining qualitative data
○ What could make sense to calculate?
■ Frequency table
■ Minimum, maximum
■ Range
■ Mode
○ What graphical techniques can be applied?
■ Pie chart
, ■ Bar chart
● Examining quantitative data - quantitative data allows for more techniques
○ What could make sense to calculate?
■ Mean, mode, median
■ Range, interquartile range
■ Standard deviation, variance
■ Skewness, Kurtosis →
○ What graphical techniques can be applied?
■ Boxplot
■ Scatterplot
■ Histogram
■ Boxplots and histograms present the distribution of a quantitative variable
Quantitative data - what should we do to analyze data
- Detect the major features of the probability distribution of the variables
- The shape of the probability distribution is important →
for the measures of centrality and dispersion of the data
Quantitative data - which central measures(s) are robust to outliers?
- Identifying and removing outliers can be crucial for an analysis
Quantitative data - analyzing relations
- Use graphical methods to investigate relationships
- An alternative could be a crosstabulation
- Important goal: transparency
Examining both types of data - you can also visualize the relation
of qualitative and quantitative data at the same time
What can we do with the characteristics of the data?
● Design a correct model reproducing the features of the
data
● Choose an adequate technique for the analysis
○ Is the sample size large enough?
○ Are the assumptions required by the chosen analysis technique satisfied by the data?
○ Do we have all the necessary data to apply correctly the chosen analysis technique?
● Transform the data before studying it if necessary (use logarithms, squares, square roots)
Types of samples
● Independent samples: the groups in the data do not correspond to each other
○ The number of observations in each group can be different
● Matched pairs: the groups in the data correspond to each other
○ The number of observations in each group are always the same
In which case do we have to test for equality of variances?