Quantitative Genetics
Discontinuous (Qualitative) traits can be categorised into a few
classes – exhibits only a few, easily distinguished phenotypes
Continuous (Quantitative) characteristics vary along a scale of
measurement – exhibits a continuous range of phenotypes
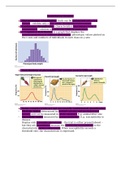
A frequency distribution is a graph that displays the
number/proportion of different phenotypes: phenotypic values plotted on
the x axis and numbers of individuals in each class on y axis
Distributions of phenotypes can assume several different shapes:
Some complex traits are not necessarily continuously quantitative:
- Meristic traits: determined by multiple genetic and environmental
factors, and can be measured in whole numbers. E.g. animal litter size
- Threshold traits: measured by presence/absence. E.g. susceptibility to
disease
Display only 2 possible phenotypes – the trait is either present/absent –
but they are quantitative because the underlying susceptibility to the
characteristic varies continuously. When susceptibility exceeds a
threshold vale, the characteristic is expressed.
, Connecting genotype to phenotype for complex traits: need to start
by understanding that genotypes generally do not produce ‘distinct’
phenotypes
- For a quantitative characteristic, each genotype may produce a
range of possible phenotypes: in this example, phenotypes produced
by AA, Aa and aa overlap.
- Complex traits are polygenic: phenotype reflects the cumulative
effects of many genes/loci, whilst also being influenced by environmental
factors.
- So we see continuous variation:
- Edward East conducted an early statistical study of the inheritance of flower length in
tobacco:
Discontinuous (Qualitative) traits can be categorised into a few
classes – exhibits only a few, easily distinguished phenotypes
Continuous (Quantitative) characteristics vary along a scale of
measurement – exhibits a continuous range of phenotypes
A frequency distribution is a graph that displays the
number/proportion of different phenotypes: phenotypic values plotted on
the x axis and numbers of individuals in each class on y axis
Distributions of phenotypes can assume several different shapes:
Some complex traits are not necessarily continuously quantitative:
- Meristic traits: determined by multiple genetic and environmental
factors, and can be measured in whole numbers. E.g. animal litter size
- Threshold traits: measured by presence/absence. E.g. susceptibility to
disease
Display only 2 possible phenotypes – the trait is either present/absent –
but they are quantitative because the underlying susceptibility to the
characteristic varies continuously. When susceptibility exceeds a
threshold vale, the characteristic is expressed.
, Connecting genotype to phenotype for complex traits: need to start
by understanding that genotypes generally do not produce ‘distinct’
phenotypes
- For a quantitative characteristic, each genotype may produce a
range of possible phenotypes: in this example, phenotypes produced
by AA, Aa and aa overlap.
- Complex traits are polygenic: phenotype reflects the cumulative
effects of many genes/loci, whilst also being influenced by environmental
factors.
- So we see continuous variation:
- Edward East conducted an early statistical study of the inheritance of flower length in
tobacco: