Business revenue and costs
Breakeven is when total revenue is equal to total costs.
Revenue is the money a business makes from sales (price * quantity sold)
Profit = total revenue – total costs
Fixed + variable = total costs
Fixed costs are costs that do not vary with output
Variable costs vary in direct proportion to output
Direct costs are costs that arise specifically from the production of a product or the
provision of a service. E.g., rent on a shop
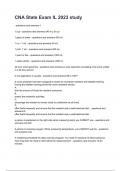
Break even = fixed costs/contribution per unit or (selling price of 1 unit – variable cost of 1
unit)
Contribution per unit = selling price of one unit per output – variable cost of producing that
unit.
How to draw the breakeven graph:
1) Work out the breakeven from the formula
2) Plot on the fixed costs line and label (FC)
3) Plot on the total costs line and label (TC)
4) Plot on the revenue line (selling price * max units) label (TR)
5) Plot on the breakeven point and label (BE)
Margin of safety is the difference between how much the business is producing and its
breakeven point.
Breakeven is when total revenue is equal to total costs.
Revenue is the money a business makes from sales (price * quantity sold)
Profit = total revenue – total costs
Fixed + variable = total costs
Fixed costs are costs that do not vary with output
Variable costs vary in direct proportion to output
Direct costs are costs that arise specifically from the production of a product or the
provision of a service. E.g., rent on a shop
Break even = fixed costs/contribution per unit or (selling price of 1 unit – variable cost of 1
unit)
Contribution per unit = selling price of one unit per output – variable cost of producing that
unit.
How to draw the breakeven graph:
1) Work out the breakeven from the formula
2) Plot on the fixed costs line and label (FC)
3) Plot on the total costs line and label (TC)
4) Plot on the revenue line (selling price * max units) label (TR)
5) Plot on the breakeven point and label (BE)
Margin of safety is the difference between how much the business is producing and its
breakeven point.