Topic/Skill
Topic: ProbabilityDefinition/Tips
(Trees and Venns) Example
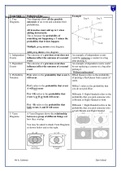
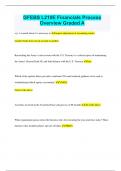
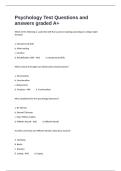
1. Tree Tree diagrams show all the possible
Diagrams outcomes of an event and calculate their
probabilities.
All branches must add up to 1 when
adding downwards.
This is because the probability of
something not happening is 1 minus the
probability that it does happen.
Multiply going across a tree diagram.
Add going down a tree diagram.
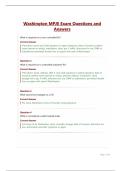
2. Independent The outcome of a previous event does not An example of independent events
Events influence/affect the outcome of a second could be replacing a counter in a bag
event. after picking it.
3. Dependent The outcome of a previous event does An example of dependent events could
Events influence/affect the outcome of a second be not replacing a counter in a bag after
event. picking it.
‘Without replacement’
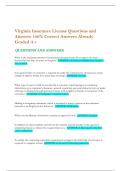
4. Probability P(A) refers to the probability that event A P(Red Queen) refers to the probability
Notation will occur. of picking a Red Queen from a pack of
cards.
P(A’) refers to the probability that event P(Blue’) refers to the probability that
A will not occur. you do not pick Blue.
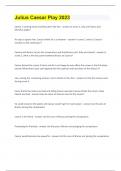
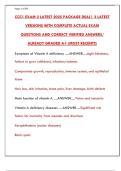
P(A ∪B) refers to the probability that P(Blonde ∪ Right Handed) refers to the
event A or B or both will occur. probability that you pick someone who
is Blonde or Right Handed or both.
P(A ∩B) refers to the probability that P(Blonde ∩ Right Handed) refers to the
both events A and B will occur. probability that you pick someone who
is both Blonde and Right Handed.
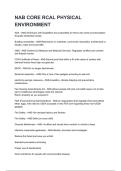
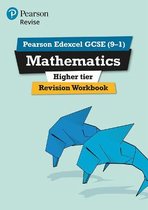
5. Venn A Venn Diagram shows the relationship
Diagrams between a group of different things and
how they overlap.
You may be asked to shade Venn Diagrams
as shown below and to the right.
Mr A. Coleman Glyn School
Topic: ProbabilityDefinition/Tips
(Trees and Venns) Example
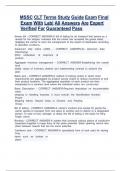
1. Tree Tree diagrams show all the possible
Diagrams outcomes of an event and calculate their
probabilities.
All branches must add up to 1 when
adding downwards.
This is because the probability of
something not happening is 1 minus the
probability that it does happen.
Multiply going across a tree diagram.
Add going down a tree diagram.
2. Independent The outcome of a previous event does not An example of independent events
Events influence/affect the outcome of a second could be replacing a counter in a bag
event. after picking it.
3. Dependent The outcome of a previous event does An example of dependent events could
Events influence/affect the outcome of a second be not replacing a counter in a bag after
event. picking it.
‘Without replacement’
4. Probability P(A) refers to the probability that event A P(Red Queen) refers to the probability
Notation will occur. of picking a Red Queen from a pack of
cards.
P(A’) refers to the probability that event P(Blue’) refers to the probability that
A will not occur. you do not pick Blue.
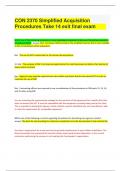
P(A ∪B) refers to the probability that P(Blonde ∪ Right Handed) refers to the
event A or B or both will occur. probability that you pick someone who
is Blonde or Right Handed or both.
P(A ∩B) refers to the probability that P(Blonde ∩ Right Handed) refers to the
both events A and B will occur. probability that you pick someone who
is both Blonde and Right Handed.
5. Venn A Venn Diagram shows the relationship
Diagrams between a group of different things and
how they overlap.
You may be asked to shade Venn Diagrams
as shown below and to the right.
Mr A. Coleman Glyn School