Topic/Skill Definition/Tips Example
Topic: Scatter Graphs
1. Correlation Correlation between two sets of data means There is correlation between
they are connected in some way. temperature and the number of ice
creams sold.
2. Causality When one variable influences another The more hours you work at a
variable. particular job (paid hourly), the higher
your income from that job will be.
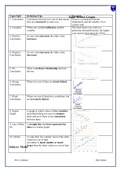
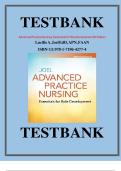
3. Positive As one value increases the other value
Correlation increases.
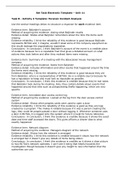
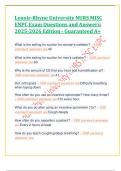
4. Negative As one value increases the other value
Correlation decreases.
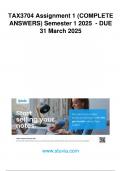
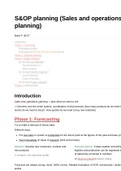
5. No There is no linear relationship between
Correlation the two.
6. Strong When two sets of data are closely linked.
Correlation
7. Weak When two sets of data have correlation, but
Correlation are not closely linked.
8. Scatter A graph in which values of two variables
Graph are plotted along two axes to compare
them and see if there is any connection
between them.
9. Line of Best A straight line that best represents the
Fit data on a scatter graph.
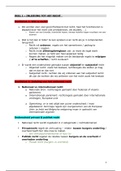
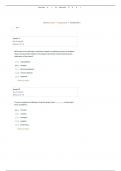
10. Outlier A value that ‘lies outside’ most of the other
values in a set of data.
An outlier is much smaller or much
larger than the other values in a set of data.
Subject: Maths
Mr A. Coleman Glyn School
Topic: Scatter Graphs
1. Correlation Correlation between two sets of data means There is correlation between
they are connected in some way. temperature and the number of ice
creams sold.
2. Causality When one variable influences another The more hours you work at a
variable. particular job (paid hourly), the higher
your income from that job will be.
3. Positive As one value increases the other value
Correlation increases.
4. Negative As one value increases the other value
Correlation decreases.
5. No There is no linear relationship between
Correlation the two.
6. Strong When two sets of data are closely linked.
Correlation
7. Weak When two sets of data have correlation, but
Correlation are not closely linked.
8. Scatter A graph in which values of two variables
Graph are plotted along two axes to compare
them and see if there is any connection
between them.
9. Line of Best A straight line that best represents the
Fit data on a scatter graph.
10. Outlier A value that ‘lies outside’ most of the other
values in a set of data.
An outlier is much smaller or much
larger than the other values in a set of data.
Subject: Maths
Mr A. Coleman Glyn School