Business Research Statistics ll
Training week 1, Q3
Representation of data from a research
- Length of student
- Minutes watching tv
- Grams per bag
- Defects per dy
- Price of TV Sets
Male/female
Judgment: good – mediocre – bad
Measurement of scales (levels)
Descriptive Statistics versus Inferential Statistics
Descriptive
Describing the characteristics of a set of data (entire population)
o Mean, modus, median, standard deviation
o Making tables and charts
Inferential
Using data of a smaller group to conclude something about the bigger
group
o Sample versus population
o Estimating
o Testing
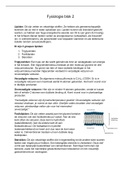
, Normal distribution
4 characteristics:
1. “bell shaped” symmetrical
2. Mean = median = mode
3. Asymptotic no outliers
4. Probabilities or proportion of the area under the curve is add to 1
(=100%)
Area under the curve = % observations / cases / probability
Standard deviation
SD Z-score = average distance to the mean
Transformation formula
Any normal distribution (with any mean and standards deviation combination)
can be transformed into the standardized normal distribution Z-Table. With
the transformation formula you convert a normal variable X to a standardized
normal variable Z.
Z= +1.00, area between the mean and the Z-score is 34,13%. The exact area
underneath the curve that is contained between the z-score and the mean.
Training week 2, Q3
Sampling
Population – all members of a group about which you want to draw a conclusion
parameter – numerical measure that describes a characteristic of a population
Training week 1, Q3
Representation of data from a research
- Length of student
- Minutes watching tv
- Grams per bag
- Defects per dy
- Price of TV Sets
Male/female
Judgment: good – mediocre – bad
Measurement of scales (levels)
Descriptive Statistics versus Inferential Statistics
Descriptive
Describing the characteristics of a set of data (entire population)
o Mean, modus, median, standard deviation
o Making tables and charts
Inferential
Using data of a smaller group to conclude something about the bigger
group
o Sample versus population
o Estimating
o Testing
, Normal distribution
4 characteristics:
1. “bell shaped” symmetrical
2. Mean = median = mode
3. Asymptotic no outliers
4. Probabilities or proportion of the area under the curve is add to 1
(=100%)
Area under the curve = % observations / cases / probability
Standard deviation
SD Z-score = average distance to the mean
Transformation formula
Any normal distribution (with any mean and standards deviation combination)
can be transformed into the standardized normal distribution Z-Table. With
the transformation formula you convert a normal variable X to a standardized
normal variable Z.
Z= +1.00, area between the mean and the Z-score is 34,13%. The exact area
underneath the curve that is contained between the z-score and the mean.
Training week 2, Q3
Sampling
Population – all members of a group about which you want to draw a conclusion
parameter – numerical measure that describes a characteristic of a population