Unit 10 – Assignment 2
Discrete Continuous
(Whole numbers), 1, 5, 2, 3 etc. it allows numerical data such as 1.45,
52.35 etc. This is a more precise
measurement of data.
Ungrouped data Grouped
This is the raw data; it hasn’t been The data that has been put together,
sorted or categorised. It is a list of it is categorised and shown in tables,
numbers. graphs.
Central tendency
This is the single value that attempts
to describe a set of data by identifying
the central position.
Excel formulas
Mode =MODE(Num1, Num2)
Median =MEDIAN(Num1, Num2)
Mode =MODE.MULT(Num1, Num2)
Range =MAX()-MIN()
Q1 = TOP %25 =QUARTILE.INC(num1, num2,1)
Q3 = BOTTOM %25 =QUARTILE.INC(num1, num2,3)
INTER QUARTILE RANGE (IQR) =SUM(Q3cell-Q1cell)
VARIENCE =VAR.S(Num1, Num2)
Standard Deviation STDEV.S(Num1, Num2)
Variance measures how each number within the data set is from the mean and
from every other number in the set.
Standard deviation is a measure of the amount of dispersion of the data set. Low
standard deviation means that the values are close to the mean, high standard
deviation means that the values are spread out.
Introduction to the assignment.
In this assignment, I will be starting as a newbie for an internship at an
educational charity. The director of the charity has been interested in how big
data and data analytics might be used by the organisation to improve the way
they target their efforts so that the work they do can be as effective and
organised as possible. Following the brief, the director has been asked to look
into statistical tools and techniques, which can be used to analyse and
manipulate data. The charity has given me access to a data that contains GCSE
results in England. They are trying to spot how the data differs from those by
the local authority and also by gender.
, When it comes to mentioning how reliable each method is, we must first
research into them and understand their properties and how they work. We must
understand how to use them in our data. Starting with the Median, which is a
method used to find the middle number in a set of data and ensuring this
number is sorted in ascending or descending order. A list of numbers can be a
bit more descriptive of the data set than the average, which we will mention
next. The median can be used as opposed to the mean when there are
anomalies in the sequency that might potentially impact or change the average
of the values. In order for us to determine the median value in a sequency of
numbers, the numbers in the data set must firstly be sorted or arranged in the
value from the lowest to the highest.
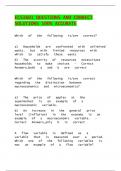
Luckily for us, we have the access
to a software that can make our life easier, but
arranging the numbers for us, using a simple formula.
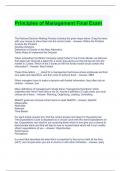
The software used in this example is excel, and as you
can see we have a set of data for Boys and their GCSE
result. For this example, we will be using the 5 A*-C
column. When we input the =MEDIAN(G4:G14) the
software collects the numbers from cell G4 to cell G14,
which is all the numbers in the set, and arranging
them for us from the lowest to the highest. Using the
PREFIX =MEDIAN in front, it allow us to calculate or
in other words the software calculates the MEDIAN value for us and returns it to
1 decimal place.
The second method that we used in our set of data, would be average. In
statistics the mean of a set of numbers, classify as the average value of those
numbers. In order for us to find the Average or the mean we add up all the
numbers and we divide them by how many there are in a set. The average is
quite the same as the mean, they are both measures of the central tendency.
They tell us what the most typical number in a data set or which numbers is best
represents all of the numbers that are included in the set.
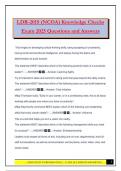
, As we can see, we have access to a software that will
do the job for us. By selecting the cells G4 to G14, we are simply commanding
the software to add up all of the numbers and when using the =AVERAGE prefix,
we tell the program to use all of the numbers from G4 to G14 and divide them
by how many they are. The average we receive is rounded up to 1 Decimal
place.
Rounding up the set of data. There are ways we can reduce our data, at least
visually and make it easier to understand by decreasing the amount of decimal
places or rounding it up. In excel there is an option that allows us to do it by
simply clicking on a button.
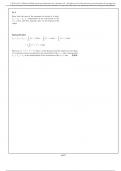
Let’s say we want to decrease the
amount of data we see in the
columns for the Standard deviation
and the variance. As shown, we
have a lot of decimals and it can be
confusing, especially for people
that are not familiar with it. In
order to reduce it, we simply click
on the following button: this button, allows us to decrease the decimal
places when a field is highlighted. We can also increase the decimals by using
the button next to it . An example of what a reduced variant of this data
might look like is the following:
As you can see, we went all the way from 27.57472.. to 28 and from 28.77072..
to 29. This can be useful when we have to add up and subtract data, it will allow
us to get simpler, but not accurate results.
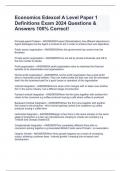
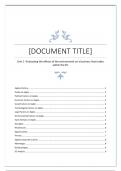
Throughout this data set, we have
some anomalies such as when using
the mode as shown on the diagram we have experienced an error that comes up
under #N/A, meaning our data is not very reliable. The mode is the value that
appears the most often in a data set and it can be used as a measure of central
tendency. As shown on the image, we can see that no results are displayed for
the mode meaning our data is not so realisable as the result can not be properly
obtained, due to the numbers being in an uncooperative range.
Throughout this data set, we will be working with standard deviation. Standard
deviation is a measure which shows us how much variation (such as the spread,
dispersion) from the mean exists. The standard deviation shows a typical
deviation from the mean. It is a popular measure of variability as it returns to
Discrete Continuous
(Whole numbers), 1, 5, 2, 3 etc. it allows numerical data such as 1.45,
52.35 etc. This is a more precise
measurement of data.
Ungrouped data Grouped
This is the raw data; it hasn’t been The data that has been put together,
sorted or categorised. It is a list of it is categorised and shown in tables,
numbers. graphs.
Central tendency
This is the single value that attempts
to describe a set of data by identifying
the central position.
Excel formulas
Mode =MODE(Num1, Num2)
Median =MEDIAN(Num1, Num2)
Mode =MODE.MULT(Num1, Num2)
Range =MAX()-MIN()
Q1 = TOP %25 =QUARTILE.INC(num1, num2,1)
Q3 = BOTTOM %25 =QUARTILE.INC(num1, num2,3)
INTER QUARTILE RANGE (IQR) =SUM(Q3cell-Q1cell)
VARIENCE =VAR.S(Num1, Num2)
Standard Deviation STDEV.S(Num1, Num2)
Variance measures how each number within the data set is from the mean and
from every other number in the set.
Standard deviation is a measure of the amount of dispersion of the data set. Low
standard deviation means that the values are close to the mean, high standard
deviation means that the values are spread out.
Introduction to the assignment.
In this assignment, I will be starting as a newbie for an internship at an
educational charity. The director of the charity has been interested in how big
data and data analytics might be used by the organisation to improve the way
they target their efforts so that the work they do can be as effective and
organised as possible. Following the brief, the director has been asked to look
into statistical tools and techniques, which can be used to analyse and
manipulate data. The charity has given me access to a data that contains GCSE
results in England. They are trying to spot how the data differs from those by
the local authority and also by gender.
, When it comes to mentioning how reliable each method is, we must first
research into them and understand their properties and how they work. We must
understand how to use them in our data. Starting with the Median, which is a
method used to find the middle number in a set of data and ensuring this
number is sorted in ascending or descending order. A list of numbers can be a
bit more descriptive of the data set than the average, which we will mention
next. The median can be used as opposed to the mean when there are
anomalies in the sequency that might potentially impact or change the average
of the values. In order for us to determine the median value in a sequency of
numbers, the numbers in the data set must firstly be sorted or arranged in the
value from the lowest to the highest.
Luckily for us, we have the access
to a software that can make our life easier, but
arranging the numbers for us, using a simple formula.
The software used in this example is excel, and as you
can see we have a set of data for Boys and their GCSE
result. For this example, we will be using the 5 A*-C
column. When we input the =MEDIAN(G4:G14) the
software collects the numbers from cell G4 to cell G14,
which is all the numbers in the set, and arranging
them for us from the lowest to the highest. Using the
PREFIX =MEDIAN in front, it allow us to calculate or
in other words the software calculates the MEDIAN value for us and returns it to
1 decimal place.
The second method that we used in our set of data, would be average. In
statistics the mean of a set of numbers, classify as the average value of those
numbers. In order for us to find the Average or the mean we add up all the
numbers and we divide them by how many there are in a set. The average is
quite the same as the mean, they are both measures of the central tendency.
They tell us what the most typical number in a data set or which numbers is best
represents all of the numbers that are included in the set.
, As we can see, we have access to a software that will
do the job for us. By selecting the cells G4 to G14, we are simply commanding
the software to add up all of the numbers and when using the =AVERAGE prefix,
we tell the program to use all of the numbers from G4 to G14 and divide them
by how many they are. The average we receive is rounded up to 1 Decimal
place.
Rounding up the set of data. There are ways we can reduce our data, at least
visually and make it easier to understand by decreasing the amount of decimal
places or rounding it up. In excel there is an option that allows us to do it by
simply clicking on a button.
Let’s say we want to decrease the
amount of data we see in the
columns for the Standard deviation
and the variance. As shown, we
have a lot of decimals and it can be
confusing, especially for people
that are not familiar with it. In
order to reduce it, we simply click
on the following button: this button, allows us to decrease the decimal
places when a field is highlighted. We can also increase the decimals by using
the button next to it . An example of what a reduced variant of this data
might look like is the following:
As you can see, we went all the way from 27.57472.. to 28 and from 28.77072..
to 29. This can be useful when we have to add up and subtract data, it will allow
us to get simpler, but not accurate results.
Throughout this data set, we have
some anomalies such as when using
the mode as shown on the diagram we have experienced an error that comes up
under #N/A, meaning our data is not very reliable. The mode is the value that
appears the most often in a data set and it can be used as a measure of central
tendency. As shown on the image, we can see that no results are displayed for
the mode meaning our data is not so realisable as the result can not be properly
obtained, due to the numbers being in an uncooperative range.
Throughout this data set, we will be working with standard deviation. Standard
deviation is a measure which shows us how much variation (such as the spread,
dispersion) from the mean exists. The standard deviation shows a typical
deviation from the mean. It is a popular measure of variability as it returns to