Question 1 of 20
1.0/ 1.0 Points
An urban economist is curious if the distribution in where Oregon residents live is different today
than it was in 1990. She observes that today there are approximately 3,109 thousand residents in
NW Oregon, 902 thousand residents in SW Oregon, 244 thousand in Central Oregon, and
102 thousand in Eastern Oregon. She knows that in 1990 the breakdown was as follows: 72.7%
NW Oregon, 20.7% SW Oregon, 4.8% Central Oregon, and 2.8% Eastern Oregon.
Can she conclude that the distribution in residence is different today at a 0.05 level of
significance?
A.
yes because the p-value = .0009
B.
no, because the p-value = .0009
C.
yes because the p-value = .0172
D.
no because the p-value = .0172
Answer Key:C
Feedback:
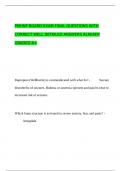
NW Central Eastern
SW Oregon
Oregon Oregon Oregon
Observed
3109 902 244 102
Counts
Expected 4357*.727 4357*.207= 4357*.048=4357*.028=
Counts = 3167.539 901.899 209.136 121.996
Use Excel to find the p-value
=CHISQ.TEST(Highlight Observed, Highlight Expected)
p-value is < .05, Reject Ho. Yes, this is significant.
Question 2 of 20
1.0/ 1.0 Points
,Pamplona, Spain is the home of the festival of San Fermin – The Running of the Bulls. The town
is in festival mode for a week and a half every year at the beginning of July. There is a running
joke in the city, that Pamplona has a baby boom every April – 9 months after San Fermin. To test
this claim, a resident takes a random sample of 300 birthdays from native residents and finds the
following observed counts:
January 25
February 25
March 27
April 26
May 21
June 26
July 22
August 27
September 21
October 26
November 28
December 26
At the 0.05 level of significance, can it be concluded that births in Pamplona are not equally
distributed throughout the 12 months of the year?
Hypotheses:
H0: Births in Pamplona ______ equally distributed throughout the year.
H1: Births in Pamplona ______ equally distributed throughout the year.
Select the best fit choices that fit in the two blank spaces above.
A.
are, are not
B.
are not, are
C.
are, are
D.
are not, are not
,Answer Key:A
Question 3 of 20
0.0/ 1.0 Points
Students at a high school are asked to evaluate their experience in the class at the end of each
school year. The courses are evaluated on a 1-4 scale – with 4 being the best experience
possible. In the History Department, the courses typically are evaluated at 10% 1’s, 15% 2’s,
34% 3’s, and 41% 4’s.
Mr. Goodman sets a goal to outscore these numbers. At the end of the year he takes a random
sample of his evaluations and finds 10 1’s, 13 2’s, 48 3’s, and 52 4’s. At the 0.05 level of
significance, can Mr. Goodman claim that his evaluations are significantly different than the
History Department’s?
A.
yes, the p-value = 0.5893
B.
no, the p-value = 0.5893
C.
no, the p-value = 0.3913
D.
yes, the p-value = 0.3913
Answer Key:C
Feedback:
1's 2's 3's 4's
Observed
10 13 48 52
Counts
Expected 123 *.10 = 123*.15 = 123*.34 = 123*.41 =
Counts 12.3 18.45 41.82 50.43
Use Excel to find the p-value
, =CHISQ.TEST(Highlight Observed, Highlight Expected)
p-value > .05, Do Not Reject Ho. No, this is not significant.
Question 4 of 20
0.0/ 1.0 Points
Click to see additional instructions
A college professor is curious if the location of a seat in class affects grades in the class.
They are teaching in a lecture hall with 240 students. The lecture hall has 10 rows, so
they split the rows into 5 sections – Rows 1-2, Rows 3-4, Rows 5-6, Rows 7-8, and Rows
9-10. At the end of the course, they determine the top 25% of grades in the class, and if
the location of the seat makes no difference, they would expect that these top 25% of
students would be equally dispersed throughout the classroom. Their observations are
recorded below. Run a Goodness of Fit test to determine whether or not location has an
impact on the grade. Let α=0.05.
Enter the expected count for each section in the table below. Enter whole numbers without any
decimals.
Rows 1-2 Rows 3-4 Rows 5-6 Rows 7-8 Rows 9-10
# in Top 25% 14 8 13 10 15
Expected Counts
Answer Key:12, 12, 12, 12, 12
Feedback:
Top 25% of 240 is
240*.25 = 60, then divide this equally among the 5 groups.
60/5
Question 5 of 20
1.0/ 1.0 Points
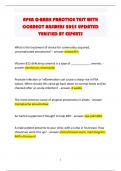
The permanent residence of adults aged 18-25 in the U.S. was examined in a survey from the
year 2000. The survey revealed that 27% of these adults lived alone, 32% lived with a
roommate(s), and 41% lived with their parents/guardians. In 2008, during an economic recession
in the country, another such survey of 1600 people revealed that 398 lived alone, 488 lived with
a roommate(s), and 714 lived with their parents.
Is there a significant difference in where young adults lived in 2000 versus 2008 and state the p-
value? Test with a Goodness of Fit test at α=0.05.
Alon Roommat Parents/Guardi
e es ans
Observ
ed 398 488 714
Counts
1.0/ 1.0 Points
An urban economist is curious if the distribution in where Oregon residents live is different today
than it was in 1990. She observes that today there are approximately 3,109 thousand residents in
NW Oregon, 902 thousand residents in SW Oregon, 244 thousand in Central Oregon, and
102 thousand in Eastern Oregon. She knows that in 1990 the breakdown was as follows: 72.7%
NW Oregon, 20.7% SW Oregon, 4.8% Central Oregon, and 2.8% Eastern Oregon.
Can she conclude that the distribution in residence is different today at a 0.05 level of
significance?
A.
yes because the p-value = .0009
B.
no, because the p-value = .0009
C.
yes because the p-value = .0172
D.
no because the p-value = .0172
Answer Key:C
Feedback:
NW Central Eastern
SW Oregon
Oregon Oregon Oregon
Observed
3109 902 244 102
Counts
Expected 4357*.727 4357*.207= 4357*.048=4357*.028=
Counts = 3167.539 901.899 209.136 121.996
Use Excel to find the p-value
=CHISQ.TEST(Highlight Observed, Highlight Expected)
p-value is < .05, Reject Ho. Yes, this is significant.
Question 2 of 20
1.0/ 1.0 Points
,Pamplona, Spain is the home of the festival of San Fermin – The Running of the Bulls. The town
is in festival mode for a week and a half every year at the beginning of July. There is a running
joke in the city, that Pamplona has a baby boom every April – 9 months after San Fermin. To test
this claim, a resident takes a random sample of 300 birthdays from native residents and finds the
following observed counts:
January 25
February 25
March 27
April 26
May 21
June 26
July 22
August 27
September 21
October 26
November 28
December 26
At the 0.05 level of significance, can it be concluded that births in Pamplona are not equally
distributed throughout the 12 months of the year?
Hypotheses:
H0: Births in Pamplona ______ equally distributed throughout the year.
H1: Births in Pamplona ______ equally distributed throughout the year.
Select the best fit choices that fit in the two blank spaces above.
A.
are, are not
B.
are not, are
C.
are, are
D.
are not, are not
,Answer Key:A
Question 3 of 20
0.0/ 1.0 Points
Students at a high school are asked to evaluate their experience in the class at the end of each
school year. The courses are evaluated on a 1-4 scale – with 4 being the best experience
possible. In the History Department, the courses typically are evaluated at 10% 1’s, 15% 2’s,
34% 3’s, and 41% 4’s.
Mr. Goodman sets a goal to outscore these numbers. At the end of the year he takes a random
sample of his evaluations and finds 10 1’s, 13 2’s, 48 3’s, and 52 4’s. At the 0.05 level of
significance, can Mr. Goodman claim that his evaluations are significantly different than the
History Department’s?
A.
yes, the p-value = 0.5893
B.
no, the p-value = 0.5893
C.
no, the p-value = 0.3913
D.
yes, the p-value = 0.3913
Answer Key:C
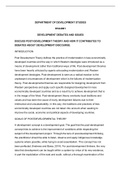
Feedback:
1's 2's 3's 4's
Observed
10 13 48 52
Counts
Expected 123 *.10 = 123*.15 = 123*.34 = 123*.41 =
Counts 12.3 18.45 41.82 50.43
Use Excel to find the p-value
, =CHISQ.TEST(Highlight Observed, Highlight Expected)
p-value > .05, Do Not Reject Ho. No, this is not significant.
Question 4 of 20
0.0/ 1.0 Points
Click to see additional instructions
A college professor is curious if the location of a seat in class affects grades in the class.
They are teaching in a lecture hall with 240 students. The lecture hall has 10 rows, so
they split the rows into 5 sections – Rows 1-2, Rows 3-4, Rows 5-6, Rows 7-8, and Rows
9-10. At the end of the course, they determine the top 25% of grades in the class, and if
the location of the seat makes no difference, they would expect that these top 25% of
students would be equally dispersed throughout the classroom. Their observations are
recorded below. Run a Goodness of Fit test to determine whether or not location has an
impact on the grade. Let α=0.05.
Enter the expected count for each section in the table below. Enter whole numbers without any
decimals.
Rows 1-2 Rows 3-4 Rows 5-6 Rows 7-8 Rows 9-10
# in Top 25% 14 8 13 10 15
Expected Counts
Answer Key:12, 12, 12, 12, 12
Feedback:
Top 25% of 240 is
240*.25 = 60, then divide this equally among the 5 groups.
60/5
Question 5 of 20
1.0/ 1.0 Points
The permanent residence of adults aged 18-25 in the U.S. was examined in a survey from the
year 2000. The survey revealed that 27% of these adults lived alone, 32% lived with a
roommate(s), and 41% lived with their parents/guardians. In 2008, during an economic recession
in the country, another such survey of 1600 people revealed that 398 lived alone, 488 lived with
a roommate(s), and 714 lived with their parents.
Is there a significant difference in where young adults lived in 2000 versus 2008 and state the p-
value? Test with a Goodness of Fit test at α=0.05.
Alon Roommat Parents/Guardi
e es ans
Observ
ed 398 488 714
Counts