Solution Manual for Managerial
Economics and Strategy, 3rd Edition,
Jeffrey M Perloff James A. Brander
117
,118
CHAPTER 2
SUPPLY AND DEMAND
SOLUTIONS TO END-OF-CHAPTER QUESTIONS
Demand
1.1 When the price of coffee changes, the change in the quantity demanded reflects a
movement along the demand curve. When other variables that affect demand
change, the entire demand curve shifts. For example, when income changes, this
causes coffee demand to shift.
Q
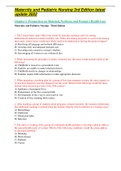
1.2 = 0.1.
Y
An increase in Y shifts the demand curve to the right, from D1 to D2.
1.3 The relationship between the quantity of coffee (𝑄) and the price of sugar (𝑝𝑠 ) is
defined by the coefficient on the 𝑝𝑠 term in the equation. Since this coefficient is
negative (it’s value is −0.3), an increase in the price of sugar (𝑝𝑠 ) will decrease the
quantity of coffee. This is the definition of a complementary good. More
, Solutions Manual—Chapter 2/Supply and Demand 119
specifically, if the price of sugar goes up by $1.00 per pound, then the demand for
coffee will fall by 300,000 tons.
1.4 The market demand curve is the sum of the quantity demanded by individual
consumers at a given price. Graphically, the market demand curve is the horizontal
sum of individual demand curves.
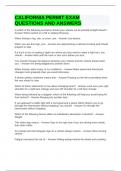
1.5 a. The inverse demand curve for other town residents is p = 200 − 0.5Qr.
b. At a price of $300, college students demand 100 units of firewood, and other
residents demand no firewood. Other residents will demand zero units of firewood
if the price is greater than or equal to $200.
c. The market demand curve is the horizontal sum of individual demand curves, as
illustrated below.
Economics and Strategy, 3rd Edition,
Jeffrey M Perloff James A. Brander
117
,118
CHAPTER 2
SUPPLY AND DEMAND
SOLUTIONS TO END-OF-CHAPTER QUESTIONS
Demand
1.1 When the price of coffee changes, the change in the quantity demanded reflects a
movement along the demand curve. When other variables that affect demand
change, the entire demand curve shifts. For example, when income changes, this
causes coffee demand to shift.
Q
1.2 = 0.1.
Y
An increase in Y shifts the demand curve to the right, from D1 to D2.
1.3 The relationship between the quantity of coffee (𝑄) and the price of sugar (𝑝𝑠 ) is
defined by the coefficient on the 𝑝𝑠 term in the equation. Since this coefficient is
negative (it’s value is −0.3), an increase in the price of sugar (𝑝𝑠 ) will decrease the
quantity of coffee. This is the definition of a complementary good. More
, Solutions Manual—Chapter 2/Supply and Demand 119
specifically, if the price of sugar goes up by $1.00 per pound, then the demand for
coffee will fall by 300,000 tons.
1.4 The market demand curve is the sum of the quantity demanded by individual
consumers at a given price. Graphically, the market demand curve is the horizontal
sum of individual demand curves.
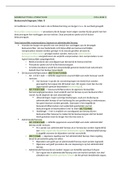
1.5 a. The inverse demand curve for other town residents is p = 200 − 0.5Qr.
b. At a price of $300, college students demand 100 units of firewood, and other
residents demand no firewood. Other residents will demand zero units of firewood
if the price is greater than or equal to $200.
c. The market demand curve is the horizontal sum of individual demand curves, as
illustrated below.