Notes Dealing with Data
Chapter 2 – Means to and end: Computing and understanding averages.
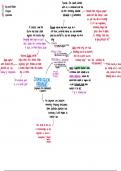
Measures of central tendency:
The average is one value that best represents a set of scores. Another name is
measures of tendency. This includes the mean, median, and mode.
Computing the mean:
- X̅ is the mean value of the group of scores.
- (sigma) tells you to add together whatever follows it.
- X is each individual score in the group.
- The n is the sample size.
Steps to computing the mean:
Step 1: List the entire set of values in one or more columns. These are all the Xs
Step 2: Compute the sum or total of all the values.
Step 3: Divide the total or sum by the number of values.
Important:
- The mean is sometimes represented by the letter M.
- n = sample size N = population size
- Sample mean is the measure of central tendency that best represents the
population mean.
- It is also called the arithmetic mean.
- Mean is like the fulcrum on a seesaw.
- Mean is VERY sensitive to extreme scores that can skew or distort findings.
Weighted mean:
Step 1: List all values for which the mean is being calculated. (List them only
once.)
Step 2: List the frequency with which each value occurs.
Step 3: Multiply the value by the frequency, as shown in the third column.
Step 4: Sum all of the values in the Value Frequency column.
Step 5: Divide by the total frequency.
Median:
The Median: the midpoint in a set of scores.
It is the point at which one half of the scores fall above and one half fall below.
,Steps to find the median:
Step 1: List the values, in order, either from highest to lowest or lowest to highest.
Step 2: Find the middlemost score. That’s the median.
Important: The mean is the middle point in a set of values, whereas the median is
the middle point in a set of cases. Because the median cares about the number of
cases, extreme scores (i.e., outliers) do not impact it.
Computing the mode:
Mode: most frequently occurring value. This the least precise measure of central
tendency. When two values occur the same number of times, there is bimodal
distribution.
Steps to finding the mode:
Step 1: List all values in the distribution, but list each value only once.
Step 2: Tally the number of times each value occurs.
Step 3: The value occurring the most is the mode.
Multimodal:
Bimodal: Distribution of two modes.
Trimodal: Distribution of three modes. (trimodal distributions are unlikely when
dealing with a large set of data points).
Scale of measurements:
Level of measurement: dictates what specific measure of central tendency you
will use. Measurement is the assignment of values to outcomes following a set of
rules. Each of the four levels has a particular set of characteristics.
You have Nominal, ordinal, interval and ratio.
Use mode when the data are qualitative, categorical, or nominal (e.g., eye color or
political party) and values can only fit into one category (i.e., mutually exclusive).
Use median when you have extreme scores.
Use mean when the data do not include extreme scores (i.e., outliers) and are not
qualitative, categorical, or nominal.
Module 1 – Introduction
, Variables:
Variable: Everything that is being measured, questioned or kept a record of in
research. It can take on different values for different individuals, like age or
gender.
Information is also called data.
Dataset: Contains information about all participants and all variables.
- A dataset looks like this Every row displays a participant. So, the number
or rows is equal to the number of participants in the research. Every column
displays a variable.
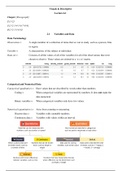
Measurement levels:
Measurement levels: The measurement level of the variable(s) determines
which statistical tools you can use.
There are four different measurement levels Nominal, ordinal, interval and ratio.
Categorial variables: Measured in groups/categories
Nominal variables: Are based on a qualitative classification without any logical
ranking. They often have categories that are mutually exclusive and are not
ordered naturally.
Example: colors, gender, or political affiliation
Ordinal variables: Are based on a qualitative classification with a logical ranking.
The ord in ordinal level of measurement stands for order, and the characteristic of
things being measured here is that they are ordered.
Example: weather alarms. They often range from none to yellow, orange and
then red. There is an inherent ranking in these different levels.
Continuous variables: Measured on a continuous scale
Interval variables: Are measured on a numerical scale. They do not have an
absolute zero, even if the value is 0. The measurement can be negative.
Example: sea level rise, measured in meters. The differences between the
values are meaningful for interval variables. The distinguishing characteristic of
interval-level scales is that the intervals along the scale are equal.
Chapter 2 – Means to and end: Computing and understanding averages.
Measures of central tendency:
The average is one value that best represents a set of scores. Another name is
measures of tendency. This includes the mean, median, and mode.
Computing the mean:
- X̅ is the mean value of the group of scores.
- (sigma) tells you to add together whatever follows it.
- X is each individual score in the group.
- The n is the sample size.
Steps to computing the mean:
Step 1: List the entire set of values in one or more columns. These are all the Xs
Step 2: Compute the sum or total of all the values.
Step 3: Divide the total or sum by the number of values.
Important:
- The mean is sometimes represented by the letter M.
- n = sample size N = population size
- Sample mean is the measure of central tendency that best represents the
population mean.
- It is also called the arithmetic mean.
- Mean is like the fulcrum on a seesaw.
- Mean is VERY sensitive to extreme scores that can skew or distort findings.
Weighted mean:
Step 1: List all values for which the mean is being calculated. (List them only
once.)
Step 2: List the frequency with which each value occurs.
Step 3: Multiply the value by the frequency, as shown in the third column.
Step 4: Sum all of the values in the Value Frequency column.
Step 5: Divide by the total frequency.
Median:
The Median: the midpoint in a set of scores.
It is the point at which one half of the scores fall above and one half fall below.
,Steps to find the median:
Step 1: List the values, in order, either from highest to lowest or lowest to highest.
Step 2: Find the middlemost score. That’s the median.
Important: The mean is the middle point in a set of values, whereas the median is
the middle point in a set of cases. Because the median cares about the number of
cases, extreme scores (i.e., outliers) do not impact it.
Computing the mode:
Mode: most frequently occurring value. This the least precise measure of central
tendency. When two values occur the same number of times, there is bimodal
distribution.
Steps to finding the mode:
Step 1: List all values in the distribution, but list each value only once.
Step 2: Tally the number of times each value occurs.
Step 3: The value occurring the most is the mode.
Multimodal:
Bimodal: Distribution of two modes.
Trimodal: Distribution of three modes. (trimodal distributions are unlikely when
dealing with a large set of data points).
Scale of measurements:
Level of measurement: dictates what specific measure of central tendency you
will use. Measurement is the assignment of values to outcomes following a set of
rules. Each of the four levels has a particular set of characteristics.
You have Nominal, ordinal, interval and ratio.
Use mode when the data are qualitative, categorical, or nominal (e.g., eye color or
political party) and values can only fit into one category (i.e., mutually exclusive).
Use median when you have extreme scores.
Use mean when the data do not include extreme scores (i.e., outliers) and are not
qualitative, categorical, or nominal.
Module 1 – Introduction
, Variables:
Variable: Everything that is being measured, questioned or kept a record of in
research. It can take on different values for different individuals, like age or
gender.
Information is also called data.
Dataset: Contains information about all participants and all variables.
- A dataset looks like this Every row displays a participant. So, the number
or rows is equal to the number of participants in the research. Every column
displays a variable.
Measurement levels:
Measurement levels: The measurement level of the variable(s) determines
which statistical tools you can use.
There are four different measurement levels Nominal, ordinal, interval and ratio.
Categorial variables: Measured in groups/categories
Nominal variables: Are based on a qualitative classification without any logical
ranking. They often have categories that are mutually exclusive and are not
ordered naturally.
Example: colors, gender, or political affiliation
Ordinal variables: Are based on a qualitative classification with a logical ranking.
The ord in ordinal level of measurement stands for order, and the characteristic of
things being measured here is that they are ordered.
Example: weather alarms. They often range from none to yellow, orange and
then red. There is an inherent ranking in these different levels.
Continuous variables: Measured on a continuous scale
Interval variables: Are measured on a numerical scale. They do not have an
absolute zero, even if the value is 0. The measurement can be negative.
Example: sea level rise, measured in meters. The differences between the
values are meaningful for interval variables. The distinguishing characteristic of
interval-level scales is that the intervals along the scale are equal.