MIDTERM QUIZ 1 VERIFIED MIDTERM QUIZ1 ISYE 6501X
MIDTERM QUIZ 1 VERIFIED MIDTERM QUIZ1 ISYE 6501X 1. Step 3: Estimate the adjusted model with a MA(1) structure for the residuals (and make sure that the MA model actually fits the residuals) For this example, the R estimate of the model is Coefficients: ma1 intercept trend dtx 0.4551 66.2633 0.2423 0.4364 s.e. 0.0753 0.4489 0.0077 0.1421 sigma^2 estimated as 2.381: log likelihood = -185.38, aic = 380.76 2. Step 4: Model diagnostics, (not shown here), suggested that the model fit well. Thus our estimated relationship between yt and xt is yt=66.26+0.24t+0.44dtxt+et The errors have the estimated relationship et=wt+0.46wt−1 , where wt∼iidN(0,σ2). R The R Program The data are in two files: and . [3] [4] Example 8-3: Glacial Varve Note that in this example it might work better to use an ARIMA model as we have a univariate time series, but we’ll use the approach of these notes for illustrative purposes. We analyze the glacial varve data described in Example 2.5, page 62 of the text. The response is a measure of the thickness of deposits of sand and silt (varve) left by spring melting of glaciers about 11,800 years ago. The data are annual estimates of varve thickness at a location in Massachusetts for 455 years beginning 11,834 years ago. There are nonconstant variance and outlier problems in the data, so we might try a log transformation with hopes of stabilizing the variance and diminishing the effects of outliers. Here’s a time series plot of the log10 series.
Written for
- Institution
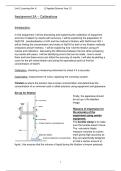
- Georgia Career Institute
- Module
- MIDTERM QUIZ 1 VERIFIED MIDTERM QUIZ1 ISYE 6501X
Document information
- Uploaded on
- December 28, 2021
- Number of pages
- 4
- Written in
- 2021/2022
- Type
- Exam (elaborations)
- Contains
- Questions & answers
Subjects
-
midterm quiz 1 verified midterm quiz1 isye 6501x
-
midterm quiz 1 verified midterm quiz1 isye 6501x graded a
-
midterm quiz 1 verified isye 6501x