PART III: SYSTEM ANALYSIS AND DESIGN EVALUATION
Chapter 7. Control Concepts and Techniques
EBW2409: SYSTEMS APPROACH TO ENVIRONMENTAL MANAGEMENT
7. CONTROL CONCEPTS AND TECHNIQUES
Most systems are deployed and then operate in an environment that changes over time.
Except for static systems, a changing environment can lead to system instability unless
control action is applied. The value of dynamic systems may be enhanced through
control action applied during operations. Control of portions or all of a system can help
maintain system performance within specified tolerances, or to increase the worth of
system output.
7.1 Some Control Concepts
A control problem may arise from the need to regulate speed, temperature, quality,
quantity, or to determine the trajectory of an aircraft or space vehicle. In each case, the
allocation of scarce resources over time is involved. Control variables must be related in
some way to state variables describing the system characteristic or condition being
controlled.
The classical example of control is the determination of a missile trajectory. Control
variables are the amount, timing, and direction of the thrust applied to the missile, where
the thrust available is constrained by fuel availability. State variables describe the
trajectory incorporating mass, position, and velocity. The thrusts and the state variables
are related by differential equations in the light of the effectiveness function to be
optimized. The objective is usually to maximize the payload that can be delivered to a
given destination.
Control problems also arise in large-scale person-equipment systems of activity. In air
traffic control, state variables are the number of aircraft enroute, the number of aircraft
waiting to land at available airports, the number of aircraft waiting on the ground, the
available number of communication channels, and so on. Control variables in air traffic
control are the instructions given by the traffic controllers.
a) The Elements of a Control System
Every control system has four basic elements. These elements always occur in the
same sequence and have the same relationship to each other. They are:
1. A controlled characteristic or condition.
2. A sensory device or method for measuring the characteristic or condition.
3. A control device that will compare measured performance with planned performance.
4. An activating device that will alter the system to bring about a change in the output
characteristic or condition being controlled.
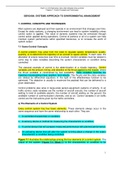
Figure 7.1 illustrates the relationships among the four elements of a control system. The
output of the system (Figure 7.1, Block 1) is the characteristic or condition to be
1
, PART III: SYSTEM ANALYSIS AND DESIGN EVALUATION
Chapter 7. Control Concepts and Techniques
measured. This output may be speed, temperature, quality, or any other characteristic or
condition of the system under consideration.
Figure 7.1 Control system elements and relationships.
The sensory device (Figure 7.1, Block 2) measures output performance. System design
must incorporate such devices as tachometers, thermocouples, thermometers,
transducers, inspectors, and other physical or human sensors. Information gathered
from a sensory device is essential to the operation of a control system.
The control device (Figure 7.1, Block 3) determines the need for control action based on
the information provided by the sensory device. It may be a minicomputer or
microcomputer, but need be no more than a visual or hand-calculated comparison
depending upon the situation. It is important that this element in the control system be
able to detect significant differences between planned output and actual output.
The out-of-control signal received from the control device must be acted upon by the
actuating device (Figure 7.1, Block 4). Actuating devices may be mechanical,
electromechanical, hydraulic, pneumatic, or they may be human, as in the case where a
machine operator changes the setting on a machine to alter the dimension of a part
being produced.
b) Types of Control Systems
There are two basic types of control systems, open-loop and closed-loop. The basic
difference is whether or not the control device is an integral part of the system it controls.
In open-loop control, the optimal control action is completely specified at the initial
time in the system cycle, whereas in closed-loop control, the action is determined
both by the initial conditions and by the current state-variable values.
While in open-loop control all decisions are-made in advance, in closed-loop control
decisions are revised in the light of new information received about the system state.
Common examples of open-loop and closed-loop control are the laundry dryer and the
home thermostat. In the laundry dryer the length of the drying cycle is set once by
human action. A home thermostat, on the other hand, provides control signals to the
furnace whenever temperature falls below a predetermined level. When a system is
regulated by a person, as in the case of a laundry dryer, attention must be paid to see
that the desired output is obtained. In this open-loop example, the drying time must be
determined by experience and be properly set into the timer.
2
, PART III: SYSTEM ANALYSIS AND DESIGN EVALUATION
Chapter 7. Control Concepts and Techniques
If control is exercised in terms of system operation, as with a thermostat, closed-loop
control is occurring. The significant difference in this type of control system is that the
control device is an element of the heating system it serves. In closed-loop control the
four elements of a control system all act together.
An essential part of a closed-loop system is feedback. Feedback is a process in which
the output of a system is measured continuously or at predetermined intervals as in
sample-data control. Generally, costs are incurred in measuring a characteristic or
condition. These costs may be in terms of added workload, energy, weight, etc. Open-
loop control requires only initial measurements and is preferred unless there are random
elements either in measurement or in system operation.
7.2 Statistical Process Control
a) Control Charts for Variables
A control chart is a graphical representation of a mathematical model used to monitor
random variable process to detect changes in a parameter of that process. It is
employed to distinguish between the existence of a stable pattern of variation and the
occurrence of an unstable pattern. If an unstable pattern of variation is detected, action
may be initiated to discover the cause of the instability. Removal of the assignable cause
should permit the process to return to the stable state.
Control charts for variables are used for continuous operations. Two charts are available
for operations of this type. The X chart is a plot over time of sample means taken from
a process. It is primarily employed to detect changes in the mean of the process from
which the samples came. The R chart is a plot over time of the ranges of these same
samples. It is employed to detect changes in the dispersion of the process.
Write brief notes on the construction and application of the above charts
b) Control Charts for Attributes (Quality or features of something)
(i) The p chart
When a characteristic or condition is sampled and then placed into one of two defined
classes, the proportion of units falling into one class may be controlled over time or from
one sample to another with a p chart.
Example 7.1
Consider the case of an activity-sampling study involving computer terminals in an office.
The objective was to determine the proportion of time the terminals were in use as
opposed to the time they were idle. One hundred observations were taken each day
over all working days in a month. The number of times the terminals were in use, and
the proportion for each day are given in Table 7.1. From this table, p is established as
total number in the class 546
p 0.260
total number of observations ( 21)(100)
The standard deviation of the data is calculated as
3
Chapter 7. Control Concepts and Techniques
EBW2409: SYSTEMS APPROACH TO ENVIRONMENTAL MANAGEMENT
7. CONTROL CONCEPTS AND TECHNIQUES
Most systems are deployed and then operate in an environment that changes over time.
Except for static systems, a changing environment can lead to system instability unless
control action is applied. The value of dynamic systems may be enhanced through
control action applied during operations. Control of portions or all of a system can help
maintain system performance within specified tolerances, or to increase the worth of
system output.
7.1 Some Control Concepts
A control problem may arise from the need to regulate speed, temperature, quality,
quantity, or to determine the trajectory of an aircraft or space vehicle. In each case, the
allocation of scarce resources over time is involved. Control variables must be related in
some way to state variables describing the system characteristic or condition being
controlled.
The classical example of control is the determination of a missile trajectory. Control
variables are the amount, timing, and direction of the thrust applied to the missile, where
the thrust available is constrained by fuel availability. State variables describe the
trajectory incorporating mass, position, and velocity. The thrusts and the state variables
are related by differential equations in the light of the effectiveness function to be
optimized. The objective is usually to maximize the payload that can be delivered to a
given destination.
Control problems also arise in large-scale person-equipment systems of activity. In air
traffic control, state variables are the number of aircraft enroute, the number of aircraft
waiting to land at available airports, the number of aircraft waiting on the ground, the
available number of communication channels, and so on. Control variables in air traffic
control are the instructions given by the traffic controllers.
a) The Elements of a Control System
Every control system has four basic elements. These elements always occur in the
same sequence and have the same relationship to each other. They are:
1. A controlled characteristic or condition.
2. A sensory device or method for measuring the characteristic or condition.
3. A control device that will compare measured performance with planned performance.
4. An activating device that will alter the system to bring about a change in the output
characteristic or condition being controlled.
Figure 7.1 illustrates the relationships among the four elements of a control system. The
output of the system (Figure 7.1, Block 1) is the characteristic or condition to be
1
, PART III: SYSTEM ANALYSIS AND DESIGN EVALUATION
Chapter 7. Control Concepts and Techniques
measured. This output may be speed, temperature, quality, or any other characteristic or
condition of the system under consideration.
Figure 7.1 Control system elements and relationships.
The sensory device (Figure 7.1, Block 2) measures output performance. System design
must incorporate such devices as tachometers, thermocouples, thermometers,
transducers, inspectors, and other physical or human sensors. Information gathered
from a sensory device is essential to the operation of a control system.
The control device (Figure 7.1, Block 3) determines the need for control action based on
the information provided by the sensory device. It may be a minicomputer or
microcomputer, but need be no more than a visual or hand-calculated comparison
depending upon the situation. It is important that this element in the control system be
able to detect significant differences between planned output and actual output.
The out-of-control signal received from the control device must be acted upon by the
actuating device (Figure 7.1, Block 4). Actuating devices may be mechanical,
electromechanical, hydraulic, pneumatic, or they may be human, as in the case where a
machine operator changes the setting on a machine to alter the dimension of a part
being produced.
b) Types of Control Systems
There are two basic types of control systems, open-loop and closed-loop. The basic
difference is whether or not the control device is an integral part of the system it controls.
In open-loop control, the optimal control action is completely specified at the initial
time in the system cycle, whereas in closed-loop control, the action is determined
both by the initial conditions and by the current state-variable values.
While in open-loop control all decisions are-made in advance, in closed-loop control
decisions are revised in the light of new information received about the system state.
Common examples of open-loop and closed-loop control are the laundry dryer and the
home thermostat. In the laundry dryer the length of the drying cycle is set once by
human action. A home thermostat, on the other hand, provides control signals to the
furnace whenever temperature falls below a predetermined level. When a system is
regulated by a person, as in the case of a laundry dryer, attention must be paid to see
that the desired output is obtained. In this open-loop example, the drying time must be
determined by experience and be properly set into the timer.
2
, PART III: SYSTEM ANALYSIS AND DESIGN EVALUATION
Chapter 7. Control Concepts and Techniques
If control is exercised in terms of system operation, as with a thermostat, closed-loop
control is occurring. The significant difference in this type of control system is that the
control device is an element of the heating system it serves. In closed-loop control the
four elements of a control system all act together.
An essential part of a closed-loop system is feedback. Feedback is a process in which
the output of a system is measured continuously or at predetermined intervals as in
sample-data control. Generally, costs are incurred in measuring a characteristic or
condition. These costs may be in terms of added workload, energy, weight, etc. Open-
loop control requires only initial measurements and is preferred unless there are random
elements either in measurement or in system operation.
7.2 Statistical Process Control
a) Control Charts for Variables
A control chart is a graphical representation of a mathematical model used to monitor
random variable process to detect changes in a parameter of that process. It is
employed to distinguish between the existence of a stable pattern of variation and the
occurrence of an unstable pattern. If an unstable pattern of variation is detected, action
may be initiated to discover the cause of the instability. Removal of the assignable cause
should permit the process to return to the stable state.
Control charts for variables are used for continuous operations. Two charts are available
for operations of this type. The X chart is a plot over time of sample means taken from
a process. It is primarily employed to detect changes in the mean of the process from
which the samples came. The R chart is a plot over time of the ranges of these same
samples. It is employed to detect changes in the dispersion of the process.
Write brief notes on the construction and application of the above charts
b) Control Charts for Attributes (Quality or features of something)
(i) The p chart
When a characteristic or condition is sampled and then placed into one of two defined
classes, the proportion of units falling into one class may be controlled over time or from
one sample to another with a p chart.
Example 7.1
Consider the case of an activity-sampling study involving computer terminals in an office.
The objective was to determine the proportion of time the terminals were in use as
opposed to the time they were idle. One hundred observations were taken each day
over all working days in a month. The number of times the terminals were in use, and
the proportion for each day are given in Table 7.1. From this table, p is established as
total number in the class 546
p 0.260
total number of observations ( 21)(100)
The standard deviation of the data is calculated as
3