Unit 2 Learning aim B: Undertake calorimetry to study cooling curves.
In this assignment I undertook two experiments to measure the heat energy that was being
released. This is called calorimetry and from this I was able to produce two cooling curves
for each experiment, whereby I could analyze and determine the melting/freezing point and
the rate of the cooling that took place.
In my first experiment, I used a calorimeter to obtain the data/results of the cooling of
candle wax and similarly in my second experiment I also used a calorimeter to obtain the
data/results of the cooling for stearic acid.
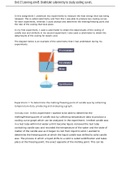
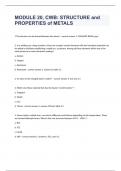
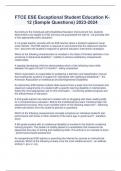
The diagram below is an example of the calorimetry that I had undertaken during my
experiments.
Experiment 1: To determine the melting/freezing point of candle wax by collecting
temperature data, producing and analysing a graph.
Introduction: In this experiment I wanted to be able to determine the
melting/freezing point of candle wax by collecting temperature data to produce a
cooling curve graph which can be analysed. In the experiment, I melted candle wax
in a test tube within hot water until it became liquid, removed the test tube
containing candle wax and recorded the temperature of the water and the state of
matter of the candle wax as it began to cool from liquid to solid. I wanted to
determine the freezing point at which the liquid candle wax shifted to solid candle
wax. The process in which a liquid shifts to a solid is called solidification and takes
place at the freezing point; the exact opposite of the melting point. This can be
In this assignment I undertook two experiments to measure the heat energy that was being
released. This is called calorimetry and from this I was able to produce two cooling curves
for each experiment, whereby I could analyze and determine the melting/freezing point and
the rate of the cooling that took place.
In my first experiment, I used a calorimeter to obtain the data/results of the cooling of
candle wax and similarly in my second experiment I also used a calorimeter to obtain the
data/results of the cooling for stearic acid.
The diagram below is an example of the calorimetry that I had undertaken during my
experiments.
Experiment 1: To determine the melting/freezing point of candle wax by collecting
temperature data, producing and analysing a graph.
Introduction: In this experiment I wanted to be able to determine the
melting/freezing point of candle wax by collecting temperature data to produce a
cooling curve graph which can be analysed. In the experiment, I melted candle wax
in a test tube within hot water until it became liquid, removed the test tube
containing candle wax and recorded the temperature of the water and the state of
matter of the candle wax as it began to cool from liquid to solid. I wanted to
determine the freezing point at which the liquid candle wax shifted to solid candle
wax. The process in which a liquid shifts to a solid is called solidification and takes
place at the freezing point; the exact opposite of the melting point. This can be