Introduction to Statistical Analysis – CM1005
SPSS Guide for doing SPSS outputs, interpreting them and calculations by hand
Useful facts to remember:
Row = unit of analysis, Column = variables
Unit of analysis is always the biggest variable in a sentence (hospital
beds and countries)
Mode: the variable which appeared most often
Median: the center of all variables
Mean: average
Correlation: a statistical procedure used to describe the strength and
direction of the linear relationship between 2 factors.
Median = 2nd quartile
Always write down the complete test statistic so: 6,051
Hypothesis are always about populations
When p-value/sigma is low, H0 has to go
With a non-directional hypothesis, you still have to state:
0.000/2=0.000
When talking about Hs and the final conclusion: In the population…
When describing the means or something else of the sample: In the
sample…
If a variable has more than 7 options, it is always interval/ratio
When referring to the sample, we use Latin (e.g., English) letters
When referring to the population, we (mostly) use Greek letters
Hypotheses are therefore always about populations, never about
samples.
Basics:
Symbols:
M -> Mean
Statistics:
Univariate: 1 variable
o What was the average grade of the ISA exam last year?
Bivariate: 1 variable affects the other one
o Did males and females differ in their grades?
Multivariate: Multiple variables affect 1 variable
o Was the grade dependent on initial motivation, the time spent on
reading and gender?
Statistics: “The study of how we describe and make inferences from
data.” (Sirkin)
o An inference is “a conclusion reached on the basis of evidence and
reasoning.”
, Introduction to Statistical Analysis – CM1005
Difference between descriptive and inferential statistics:
Descriptive statistics -> population (size N)
Describes data
Inferential statistics -> Sample (size n)
Makes predictions or generalizations
Take data from samples
o Estimate parameters
o Hypothesis testing
Units of analysis:
Unit of analysis: “the what or who that is being studied” -> rows
Variable: a measured property of each of the units of analysis -> columns
Level of measurement:
Nominal - Ordinal - Interval - Ratio
1. Can you rank them?
2. Is there an equal distance between them?
3. Is there a true zero?
Continuous vs discrete variables:
Continuous variable can be counted after the comma, so 19,09276
Discrete variable cannot be counted after the comma, so: 19 -> is counted in
whole units or categories
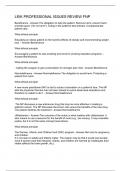
Measures of central tendency: ->
To describe the distribution of variables on different levels of measurement
Mean (also: Sum of Squares (SS)): Interval/ratio -> most useful for
describing (more or less) normally distributed variables
o Changing any score will change mean
o Sum of differences from the mean is zero:
o Sum of squared differences from the mean is minimal, because If we
had used any other value than the mean (5) to calculate the SS, it
would have been larger than 42
Median: Ordinal & interval/ratio -> often used for interval/ratio variables
that have skewed distributions
o Not as sensitive to outliers as the mean
o To determine the median from a frequency table, we need to identify
the first category that exceeds 50% in the ‘cumulative percent’ column
, Introduction to Statistical Analysis – CM1005
Mode: Nominal, ordinal, interval/ratio
o The category with the largest amount of cases
Measures of variability:
Measures of CT alone carry not enough information to adequately describe
distributions of variables, we need this type of measures
Range: Ordinal, interval/ratio
o Distance between highest and lowest score
o Always reported together with maximum & minimum score
o Sensitive to outliers
The interquartile range (IQR): Ordinal, interval/ratio
o Based on “quartiles” that split our data into four equal groups of cases
o IQR based on distance between Q1 and Q3
o Q2=median
The variance: interval/ratio
o Variance is based on the Sum of Squares (last week), i.e. the squared
distance from the mean
o For the calculation of the variance, it matters whether we have sample
data or population data (typically: sample data)
o
S^2 -> Variance in sample, Sigma^2 -> Variance in population
o (n-1) is the divisor for the sample variance
o N is the divisor for the population variance
o -> More about this in the lecture’s powerpoint
The standard deviation (SD): interval/ratio
o The SD is the square root of the variance
o The SD is an approximate measure of the average distance to the
mean
o
S -> SD for sample data, Sigma -> SD for population data
o For normally distributed variables, we can use the SD to make
statements about the distribution
o inferential statistics
Bivariate statistics:
Independent variable, i.e. a variable that we expect to influence another
variable in the model – denoted as X
Dependent variable, i.e. a variable that we expect to be influenced by at least
one (independent) variable in the model – denoted as Y
SPSS Guide for doing SPSS outputs, interpreting them and calculations by hand
Useful facts to remember:
Row = unit of analysis, Column = variables
Unit of analysis is always the biggest variable in a sentence (hospital
beds and countries)
Mode: the variable which appeared most often
Median: the center of all variables
Mean: average
Correlation: a statistical procedure used to describe the strength and
direction of the linear relationship between 2 factors.
Median = 2nd quartile
Always write down the complete test statistic so: 6,051
Hypothesis are always about populations
When p-value/sigma is low, H0 has to go
With a non-directional hypothesis, you still have to state:
0.000/2=0.000
When talking about Hs and the final conclusion: In the population…
When describing the means or something else of the sample: In the
sample…
If a variable has more than 7 options, it is always interval/ratio
When referring to the sample, we use Latin (e.g., English) letters
When referring to the population, we (mostly) use Greek letters
Hypotheses are therefore always about populations, never about
samples.
Basics:
Symbols:
M -> Mean
Statistics:
Univariate: 1 variable
o What was the average grade of the ISA exam last year?
Bivariate: 1 variable affects the other one
o Did males and females differ in their grades?
Multivariate: Multiple variables affect 1 variable
o Was the grade dependent on initial motivation, the time spent on
reading and gender?
Statistics: “The study of how we describe and make inferences from
data.” (Sirkin)
o An inference is “a conclusion reached on the basis of evidence and
reasoning.”
, Introduction to Statistical Analysis – CM1005
Difference between descriptive and inferential statistics:
Descriptive statistics -> population (size N)
Describes data
Inferential statistics -> Sample (size n)
Makes predictions or generalizations
Take data from samples
o Estimate parameters
o Hypothesis testing
Units of analysis:
Unit of analysis: “the what or who that is being studied” -> rows
Variable: a measured property of each of the units of analysis -> columns
Level of measurement:
Nominal - Ordinal - Interval - Ratio
1. Can you rank them?
2. Is there an equal distance between them?
3. Is there a true zero?
Continuous vs discrete variables:
Continuous variable can be counted after the comma, so 19,09276
Discrete variable cannot be counted after the comma, so: 19 -> is counted in
whole units or categories
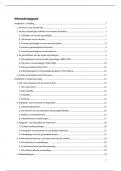
Measures of central tendency: ->
To describe the distribution of variables on different levels of measurement
Mean (also: Sum of Squares (SS)): Interval/ratio -> most useful for
describing (more or less) normally distributed variables
o Changing any score will change mean
o Sum of differences from the mean is zero:
o Sum of squared differences from the mean is minimal, because If we
had used any other value than the mean (5) to calculate the SS, it
would have been larger than 42
Median: Ordinal & interval/ratio -> often used for interval/ratio variables
that have skewed distributions
o Not as sensitive to outliers as the mean
o To determine the median from a frequency table, we need to identify
the first category that exceeds 50% in the ‘cumulative percent’ column
, Introduction to Statistical Analysis – CM1005
Mode: Nominal, ordinal, interval/ratio
o The category with the largest amount of cases
Measures of variability:
Measures of CT alone carry not enough information to adequately describe
distributions of variables, we need this type of measures
Range: Ordinal, interval/ratio
o Distance between highest and lowest score
o Always reported together with maximum & minimum score
o Sensitive to outliers
The interquartile range (IQR): Ordinal, interval/ratio
o Based on “quartiles” that split our data into four equal groups of cases
o IQR based on distance between Q1 and Q3
o Q2=median
The variance: interval/ratio
o Variance is based on the Sum of Squares (last week), i.e. the squared
distance from the mean
o For the calculation of the variance, it matters whether we have sample
data or population data (typically: sample data)
o
S^2 -> Variance in sample, Sigma^2 -> Variance in population
o (n-1) is the divisor for the sample variance
o N is the divisor for the population variance
o -> More about this in the lecture’s powerpoint
The standard deviation (SD): interval/ratio
o The SD is the square root of the variance
o The SD is an approximate measure of the average distance to the
mean
o
S -> SD for sample data, Sigma -> SD for population data
o For normally distributed variables, we can use the SD to make
statements about the distribution
o inferential statistics
Bivariate statistics:
Independent variable, i.e. a variable that we expect to influence another
variable in the model – denoted as X
Dependent variable, i.e. a variable that we expect to be influenced by at least
one (independent) variable in the model – denoted as Y