OPMT 1197
Business Statistics
Lecture 19: Hypotheses Test to Compare the Difference between 2 Proportions
A tax preparation firm is interested in comparing the quality of work at two of its offices. A
random sample of tax returns are selected from each office and verified for accuracy to
estimate the proportion of returns with errors that are prepared at each office. The difference
between these proportions is of interest.
p1 = population proportion of returns with errors for Office 1 p2 = population proportion of returns with errors for Office 2
p�1 = sample proportion for a random sample from Office 1 p�2 = sample proportion for a random sample from Office 2
The difference between the two population proportions is p1 − p2
Our point estimate for the difference between two population proportions is simply the difference between the sample proportions = p�1 − p�2
Three different hypotheses we can test for the difference between two proportions:
Lower-tail Upper-Tail Two-Tails
H0: p1 − p2 = 0 H0: p1 − p2 = 0 H0: p1 − p2 = 0
HA: p1 − p2 < 0 HA: p1 − p2 > 0 HA: p1 − p2 ≠ 0
The null hypothesis is always that the two population proportions are equal therefore p1 − p2 = 0 is the same as p1 = p2
If we reverse what we decide is Population 1 and what is Population 2, the sign for the
alternative hypothesis test would also be reversed and we can end up doing a lower-tailed test
instead of an upper-tailed test. Either case is acceptable.
Since the population proportion p is unknown, we “pool” or combine the point estimates from the two samples ( � and � ) to obtain a single point estimate of p.
�+ �
Pooled Proportion � = + =
+ +
This is simply a weighted average of the two sample proportions taken from the populations.
and are the number of successes from Sample 1 and 2
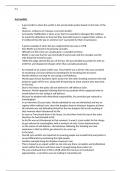
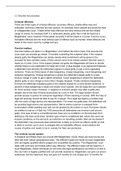
Ztest statistic to test the difference between two proportions
( � − � )−( − )
=
� � ( − �) � + �
Page 1 of 4
Business Statistics
Lecture 19: Hypotheses Test to Compare the Difference between 2 Proportions
A tax preparation firm is interested in comparing the quality of work at two of its offices. A
random sample of tax returns are selected from each office and verified for accuracy to
estimate the proportion of returns with errors that are prepared at each office. The difference
between these proportions is of interest.
p1 = population proportion of returns with errors for Office 1 p2 = population proportion of returns with errors for Office 2
p�1 = sample proportion for a random sample from Office 1 p�2 = sample proportion for a random sample from Office 2
The difference between the two population proportions is p1 − p2
Our point estimate for the difference between two population proportions is simply the difference between the sample proportions = p�1 − p�2
Three different hypotheses we can test for the difference between two proportions:
Lower-tail Upper-Tail Two-Tails
H0: p1 − p2 = 0 H0: p1 − p2 = 0 H0: p1 − p2 = 0
HA: p1 − p2 < 0 HA: p1 − p2 > 0 HA: p1 − p2 ≠ 0
The null hypothesis is always that the two population proportions are equal therefore p1 − p2 = 0 is the same as p1 = p2
If we reverse what we decide is Population 1 and what is Population 2, the sign for the
alternative hypothesis test would also be reversed and we can end up doing a lower-tailed test
instead of an upper-tailed test. Either case is acceptable.
Since the population proportion p is unknown, we “pool” or combine the point estimates from the two samples ( � and � ) to obtain a single point estimate of p.
�+ �
Pooled Proportion � = + =
+ +
This is simply a weighted average of the two sample proportions taken from the populations.
and are the number of successes from Sample 1 and 2
Ztest statistic to test the difference between two proportions
( � − � )−( − )
=
� � ( − �) � + �
Page 1 of 4