Level 3 Btec National Extended Diploma in Business
Unit 26: Managing Business Information
Data Manipulation Exercises
Subject Teacher: Silver King
ASSESSMENT GRADING CRITERION
P5: Input and manipulate the data entered into data management software.
P6: Produce information in suitable formats to support decision making.
M2: Compare the features of different types of software used in producing information to support business activities.
M3: Analyse information produced in different formats to support business decision making.
Student Name Klein Luyindula
,Level 3 Btec National Extended Diploma in Business
Unit 26: Managing Business Information
Subject Teacher: Silver King
Klein Luyindula
Table 1: Weekly Course Group Attendance Data Performance – L3Yr2 Business
Ind Institution Learning Curriculum Delivery Weeks Online Remote Learning
Wk. Curriculum Delivery Weeks
(High Medium Low)
COURSE AVERAGE
Red/ Amber/ Green
Number of Weeks and Dates
RAG-Rated
Risk Level
COURSE
28.09.20
19.10.20
09.11.20
30.11.20
14.12.20
21.12.20
04.01.21
11.01.21
01.02.21
21.09.20
05.10.20
12.10.20
26.10.20
02.11.20
16.11.20
23.11.20
07.12.20
28.12.20
18.01.21
25.01.21
GROUP
1 2 3 4 5 6 7 8 9 10 11 12 13 14 15 16 17 18 19 20
R.1 M Amber 82% 100% 93% 89% 88% 94% 91% 91% 88% 58% 87% 85% 80% 77% 70% 79% 58% 71% 66%
R.2 M Amber 83% 100% 93% 91% 90% 89% 95% 92% 88% 59% 89% 86% 82% 80% 73% 82% 60% 73% 69% 78%
R.3 M Amber 84% 100% 93% 91% 90% 89% 95% 92% 88% 59% 89% 86% 82% 80% 73% 82% 65% 78% 73% 80% 79%
EXTRAPOLATION DATA -
L Green 100% 100% 100% 100% 100% 100% 94% 94% 100% 100% 94% 94% 100% 100% 100% 94% 96% 96% 96% 96% 96%
Exercise 1:
A. Review the data above and recreate the information source to present in a different way.
B. Consider applying and using an alternative software.
C. The information you produce will be presented in a report for further use.
D. The report must be clear and contain information that can be used to support a business decision making.
2
, Level 3 Btec National Extended Diploma in Business
Unit 26: Managing Business Information
Subject Teacher: Silver King
Klein Luyindula
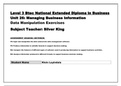
After reviewing the data from table 1, allowed me to conclude a justified recommended of coping and pasting the figures from the table onto Microsoft
excel where I placed the different figures of data into 4 columns for example R1, R2, R3 and the exploration data in which I was able to add into a line graph
chart which makes it easier to review the classes attendance within the specific weeks for example week 9 and 10 on the chart you able to see where the
attendance drastically decreases. The yellow line above indicates the exploration data or in other terms is the group’s attendance target, which they need
to be meeting every week in order to improve their attendance.
3
Unit 26: Managing Business Information
Data Manipulation Exercises
Subject Teacher: Silver King
ASSESSMENT GRADING CRITERION
P5: Input and manipulate the data entered into data management software.
P6: Produce information in suitable formats to support decision making.
M2: Compare the features of different types of software used in producing information to support business activities.
M3: Analyse information produced in different formats to support business decision making.
Student Name Klein Luyindula
,Level 3 Btec National Extended Diploma in Business
Unit 26: Managing Business Information
Subject Teacher: Silver King
Klein Luyindula
Table 1: Weekly Course Group Attendance Data Performance – L3Yr2 Business
Ind Institution Learning Curriculum Delivery Weeks Online Remote Learning
Wk. Curriculum Delivery Weeks
(High Medium Low)
COURSE AVERAGE
Red/ Amber/ Green
Number of Weeks and Dates
RAG-Rated
Risk Level
COURSE
28.09.20
19.10.20
09.11.20
30.11.20
14.12.20
21.12.20
04.01.21
11.01.21
01.02.21
21.09.20
05.10.20
12.10.20
26.10.20
02.11.20
16.11.20
23.11.20
07.12.20
28.12.20
18.01.21
25.01.21
GROUP
1 2 3 4 5 6 7 8 9 10 11 12 13 14 15 16 17 18 19 20
R.1 M Amber 82% 100% 93% 89% 88% 94% 91% 91% 88% 58% 87% 85% 80% 77% 70% 79% 58% 71% 66%
R.2 M Amber 83% 100% 93% 91% 90% 89% 95% 92% 88% 59% 89% 86% 82% 80% 73% 82% 60% 73% 69% 78%
R.3 M Amber 84% 100% 93% 91% 90% 89% 95% 92% 88% 59% 89% 86% 82% 80% 73% 82% 65% 78% 73% 80% 79%
EXTRAPOLATION DATA -
L Green 100% 100% 100% 100% 100% 100% 94% 94% 100% 100% 94% 94% 100% 100% 100% 94% 96% 96% 96% 96% 96%
Exercise 1:
A. Review the data above and recreate the information source to present in a different way.
B. Consider applying and using an alternative software.
C. The information you produce will be presented in a report for further use.
D. The report must be clear and contain information that can be used to support a business decision making.
2
, Level 3 Btec National Extended Diploma in Business
Unit 26: Managing Business Information
Subject Teacher: Silver King
Klein Luyindula
After reviewing the data from table 1, allowed me to conclude a justified recommended of coping and pasting the figures from the table onto Microsoft
excel where I placed the different figures of data into 4 columns for example R1, R2, R3 and the exploration data in which I was able to add into a line graph
chart which makes it easier to review the classes attendance within the specific weeks for example week 9 and 10 on the chart you able to see where the
attendance drastically decreases. The yellow line above indicates the exploration data or in other terms is the group’s attendance target, which they need
to be meeting every week in order to improve their attendance.
3