Project management
(week 1)
To manage stakeholders:
1. External environment
2. Stakeholder goals
3. Internal capabilities
4. Problem
5. Testing
6. Solutions
Functional structure
Pro’s: specialization, projects within the departments
Cons: Low customer focus, functional silos, lack of commitment, longer times to
implement projects.
Matrix structure
Pros: a mix between project and functional orientation, promotes cross-functional
collaboration, efficient use of resources.
Cons: leadership challenges, workers commitment, negotiation for sharing scarce
resources.
Project structure
Pros: project management specialization
Cons: project commitment rather than firm, future uncertainty, difficult to develop
intellectual capital.
(Organizational culture can be a major source of project success or failure.
,(week 3)
Project screening models (nonnumeric models)
Checklist model
Simplified scoring model
Analytic hierarchy process
Profile model
Method 1: Checklist model
A checklist is a list of criteria applies to possible projects
Requires agreement on criteria
Pros: simple and flexible, Facilitating conversation and discussion
Cons: assumes all criteria are equally important
Method 2: Simple scoring method
Each project receives a score that is the weighted sum of its grade on a list of
criteria.
Requires agreement on criteria and agreement on weights for criteria and a score
assigned for each criteria.
Pros: easy to use and understand
Cons: does not tell the difference between score, relative scores can be misleading.
Method 3: Analytic hierarchy process (AHP)
Prioritizes alternatives when multiple criteria are considered.
Evaluates trade-offs between conflicting selection criteria.
AHP is a 4 step process:
1. Construct a hierarchy of criteria and sub-criteria
2. Allocate weights to criteria
3. Assign numerical values to evaluation dimensions
4. Determine scores by summing the products of numeric evaluations and
weights.
Pros: flexible, scores can be compared.
Cons: requires all criteria in advance, requires extensive managerial input and not
parsimonious (scores are relative)
Method 4: Profile
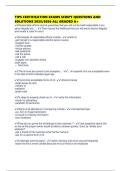
, Efficient frontier
Plot risk/return options for various alternatives
Select the project that maximizes return while staying within a certain range of
minimum acceptable risk.
Financial models (numeric models)
Payback period
Net present value
Discounted payback method
Internal rate of return
Determines how long it takes for a project to reach a breakeven point
Cash flows should be discounted
Lower numbers are better (faster payback)
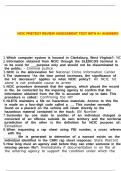
Net present value
Ft = net cash flow for period t
r = required rate of return
I = initial cash investment
Pt = inflation rate during period t
Higher NPV values are better.
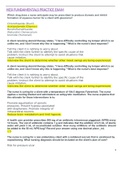
Internal rate of return
A project must meet a minimum rate of return before it is worthy of consideration. It
is the interest rate at which the NPV of the cash flows is equal to zero.
Project portfolio management
(week 1)
To manage stakeholders:
1. External environment
2. Stakeholder goals
3. Internal capabilities
4. Problem
5. Testing
6. Solutions
Functional structure
Pro’s: specialization, projects within the departments
Cons: Low customer focus, functional silos, lack of commitment, longer times to
implement projects.
Matrix structure
Pros: a mix between project and functional orientation, promotes cross-functional
collaboration, efficient use of resources.
Cons: leadership challenges, workers commitment, negotiation for sharing scarce
resources.
Project structure
Pros: project management specialization
Cons: project commitment rather than firm, future uncertainty, difficult to develop
intellectual capital.
(Organizational culture can be a major source of project success or failure.
,(week 3)
Project screening models (nonnumeric models)
Checklist model
Simplified scoring model
Analytic hierarchy process
Profile model
Method 1: Checklist model
A checklist is a list of criteria applies to possible projects
Requires agreement on criteria
Pros: simple and flexible, Facilitating conversation and discussion
Cons: assumes all criteria are equally important
Method 2: Simple scoring method
Each project receives a score that is the weighted sum of its grade on a list of
criteria.
Requires agreement on criteria and agreement on weights for criteria and a score
assigned for each criteria.
Pros: easy to use and understand
Cons: does not tell the difference between score, relative scores can be misleading.
Method 3: Analytic hierarchy process (AHP)
Prioritizes alternatives when multiple criteria are considered.
Evaluates trade-offs between conflicting selection criteria.
AHP is a 4 step process:
1. Construct a hierarchy of criteria and sub-criteria
2. Allocate weights to criteria
3. Assign numerical values to evaluation dimensions
4. Determine scores by summing the products of numeric evaluations and
weights.
Pros: flexible, scores can be compared.
Cons: requires all criteria in advance, requires extensive managerial input and not
parsimonious (scores are relative)
Method 4: Profile
, Efficient frontier
Plot risk/return options for various alternatives
Select the project that maximizes return while staying within a certain range of
minimum acceptable risk.
Financial models (numeric models)
Payback period
Net present value
Discounted payback method
Internal rate of return
Determines how long it takes for a project to reach a breakeven point
Cash flows should be discounted
Lower numbers are better (faster payback)
Net present value
Ft = net cash flow for period t
r = required rate of return
I = initial cash investment
Pt = inflation rate during period t
Higher NPV values are better.
Internal rate of return
A project must meet a minimum rate of return before it is worthy of consideration. It
is the interest rate at which the NPV of the cash flows is equal to zero.
Project portfolio management