

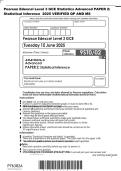
Pearson Edexcel Level 3 GCE Statistics Advanced PAPER 2:
Statistical Inference 2025 VERIFIED QP AND MS
Please check the examination details below before entering your candidate information
surname names
Number Number
Paper
9ST0/02
Statistics
Advanced
PAPER 2: Statistical Inference
You must have:
Calculator
Candidates may use any calculator allowed by Pearson regulations. Calculators
must not have retrievable mathematical formulae stored in them.
Instructions
••• IfUse
centre
Fill
black ink or ball-point pen.
pencil is used for diagrams/sketches/graphs it must be dark (HB or B).
number
in the boxesand candidate
at the number.
top of this page with your name,
• clearly labelled.
Answer all questions and ensure that your answers to parts of questions are
• Answer the questions in the spaces provided
– there may be more space than you need.
• You should show sufficient working to make your methods clear.
Answers without working may not gain full credit.
• Unless otherwise stated, inexact answers should be given to three
significant figures.
• Unless otherwise stated, statistical tests should be carried out at the
5% significance level.
Information
•• ATherebooklet ‘Statistical formulae and tables’ is provided.
are 6 questions in this question paper. The total mark for this paper is 80.
•Advice asfora guide
–
Theuse this
marks eachas to how are
question much timeintobrackets
shown spend on each question.
• Read each question carefully before you start to answer it.
•• Try to answer every question.
ICfhyeocukcyhoaunrgaensyw
ouersmifinydouabhoauvte atnimaensaw
t ethr,ecernodss. it out and put your new answer and
Y:1/1/1/1/1/1/1/1/1/1/
any working underneath.
P76382A
©2025 Pearson Education Ltd.
,Turn over
, Answer ALL questions. Write your answers in the spaces provided.
1 Since 2006 the RAC, a roadside assistance organisation, have used the RAC Pothole
DO NOT WRITE IN THIS AREA
Index to monitor the state of UK roads.
The Index is a measure of how often, on average, an RAC member requests roadside
assistance for a breakdown where damage from a pothole or other road surface defect
was most likely the cause of the breakdown.
An Index of 1.2 would mean the likelihood of pothole damage had increased by 20%
compared to 2006
A reporter sees that the most recently reported figure was 2.0 and wishes to write an
article about the likelihood of pothole damage, which she claims is now twice as great
as in 2006
[Source: How to report a pothole and claim for damage online | RAC Drive]
(a) Explain why the reporter is correct in her interpretation of the value of 2.0
(1)
DO NOT WRITE IN THIS AREA
For the years 2014 to 2021, the Pothole Index for each quarter was recorded, the
summary statistics are shown below.
x = 70.05 ( x − x )
2
= 6.5596 n = 32
(b) Test to see whether, on average, this evidence would have supported the reporter’s
claim between 2014 and 2021
(8) DO NOT WRITE IN THIS AREA
2
,
Question 1 continued
DO NOT WRITE IN THIS AREA
DO NOT WRITE IN THIS AREA
(Total for Question 1 is 9 marks)
DO NOT WRITE IN THIS AREA
3
Turn over
Statistical Inference 2025 VERIFIED QP AND MS
Please check the examination details below before entering your candidate information
surname names
Number Number
Paper
9ST0/02
Statistics
Advanced
PAPER 2: Statistical Inference
You must have:
Calculator
Candidates may use any calculator allowed by Pearson regulations. Calculators
must not have retrievable mathematical formulae stored in them.
Instructions
••• IfUse
centre
Fill
black ink or ball-point pen.
pencil is used for diagrams/sketches/graphs it must be dark (HB or B).
number
in the boxesand candidate
at the number.
top of this page with your name,
• clearly labelled.
Answer all questions and ensure that your answers to parts of questions are
• Answer the questions in the spaces provided
– there may be more space than you need.
• You should show sufficient working to make your methods clear.
Answers without working may not gain full credit.
• Unless otherwise stated, inexact answers should be given to three
significant figures.
• Unless otherwise stated, statistical tests should be carried out at the
5% significance level.
Information
•• ATherebooklet ‘Statistical formulae and tables’ is provided.
are 6 questions in this question paper. The total mark for this paper is 80.
•Advice asfora guide
–
Theuse this
marks eachas to how are
question much timeintobrackets
shown spend on each question.
• Read each question carefully before you start to answer it.
•• Try to answer every question.
ICfhyeocukcyhoaunrgaensyw
ouersmifinydouabhoauvte atnimaensaw
t ethr,ecernodss. it out and put your new answer and
Y:1/1/1/1/1/1/1/1/1/1/
any working underneath.
P76382A
©2025 Pearson Education Ltd.
,Turn over
, Answer ALL questions. Write your answers in the spaces provided.
1 Since 2006 the RAC, a roadside assistance organisation, have used the RAC Pothole
DO NOT WRITE IN THIS AREA
Index to monitor the state of UK roads.
The Index is a measure of how often, on average, an RAC member requests roadside
assistance for a breakdown where damage from a pothole or other road surface defect
was most likely the cause of the breakdown.
An Index of 1.2 would mean the likelihood of pothole damage had increased by 20%
compared to 2006
A reporter sees that the most recently reported figure was 2.0 and wishes to write an
article about the likelihood of pothole damage, which she claims is now twice as great
as in 2006
[Source: How to report a pothole and claim for damage online | RAC Drive]
(a) Explain why the reporter is correct in her interpretation of the value of 2.0
(1)
DO NOT WRITE IN THIS AREA
For the years 2014 to 2021, the Pothole Index for each quarter was recorded, the
summary statistics are shown below.
x = 70.05 ( x − x )
2
= 6.5596 n = 32
(b) Test to see whether, on average, this evidence would have supported the reporter’s
claim between 2014 and 2021
(8) DO NOT WRITE IN THIS AREA
2
,
Question 1 continued
DO NOT WRITE IN THIS AREA
DO NOT WRITE IN THIS AREA
(Total for Question 1 is 9 marks)
DO NOT WRITE IN THIS AREA
3
Turn over


