EC315 LT Week 1 – Introduction and National Income Accounting
Introduction
- International macroeconomics is the study of interdependent economies focusing on key economic wide
variables of interests:
o Current account
o Nominal exchange rate
o Interest rates
o Income
- Two key dimensions of analysis:
o Trade integration
o Financial markets integration
Recent Questions/Policy Issues
- Recent debates:
o Global imbalances; (pre-global financial crisis)
o Imbalances within the Euro area
o Crises in emerging market economies (sudden stops)
o Spillovers and policies in a world in a liquidity trap
- Questions that we address:
o Why countries run current account surplus/deficits? How do we assess sustainability?
o How are ERs determined?
o Why do rich countries have higher prices?
o What are the factors that determine currency crises?
o What is a liquidity trap and what are its consequences?
The Global Imbalance Debate
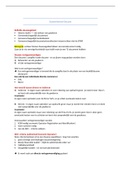
- Debate focusing on the current account of the US (red line)
- We see that it has deteriorated in the second part of the 90s,
becoming more and more in deficit, eventually reaching −6%
of GDP just before the global financial crisis
- In the years preceding this, there was a lot of debate about
whether these deficits were sustainable and if there was a
need to correct it and how this correction would occur
- The blue line looks at East Asian countries (in particular China’s
current account), and we see it is a mirror image of the big
deficits in the US, with significant surpluses, reaching almost
10% of GDP
- The green line looks at Germany, and we see in the years preceding the introduction of the Euro, it was
negative and since then it has become more and more of a surplus, reaching a peak of over 8%
How to interpret imbalances?
1. Traditional view: correction in imbalance with relative price (ER) adjustment (Obstfeld and Rogoff 2005,
2006)
2. Alternative perspective: imbalance as equilibrium outcome
a. Saving glut (Bernanke, 2005) → US had a deficit because the rest of the world was saving
b. Bretton Woods 2 → structure of the international monetary system resembles the old Bretton
Woods (hence Bretton Woods 2)
c. Financial integration (Caballero, Fahri and Gourinchas, 2008) → financial integration between
countries that are at different stages of development, so because US is more developed, the flow of
capital goes towards US
,Net Foreign Assets Evolution (selected countries)
- The net foreign asset position is a measure of the external net credit
position to the rest of the world
- The evolution of the net foreign asset positions of selected countries
shows there are big changes over time
- For example, Ireland (maroon) goes from a surplus of around 50% of
GDP just before the introduction of the Euro to a deficit of almost
100% of GDP in 2010
- Germany (black dashed line) has been accumulating net credit over
time
Basic Concepts: National Income Accounting
GNP: value of goods and services produced by the factors of production of a country in a given time period
Open economy (all output in goods and services is consumed or invested by domestic citizens or purchased by the
government): 𝑌 = 𝐶 + 𝐼 + 𝐺 + 𝐸𝑋 − 𝐼𝑀
- Expenditure view: classification depends on who bought the goods and services
o 𝐶 – consumption: amount consumed by private domestic residents
o 𝐼 – investment: amount used by private firms to build new plants and equipment (or output used by
firms to produce future output)
o 𝐺 – government consumption: amount consumed by the government
- Foreign trade:
o 𝐸𝑋 – value of exports: goods and services sold abroad
o 𝐼𝑀 – value of imports: goods and services purchased from abroad
Another measure is the GDP: value of goods and services produced within a country’s borders
- GNP = GDP + income from foreign assets (or from loans to foreigners)
- 𝑌𝑡𝐺𝑁𝑃 = 𝑌𝑡𝐺𝐷𝑃 + 𝑟𝑡 𝐵𝑡 where 𝐵 denotes the economy’s net stock of foreign assets (or loans to foreigners)
and 𝑟 is the return on foreign assets (for now think of it as an interest rate)
- Example: the income from a British owned asset (e.g. factory) located in America is not included in UK GDP,
only in UK GNP → this income is actually included in US GDP
- Ireland is an example of a country in which there is a significant gap between GNP and GDP due to the
presence of many large foreign-owned firms that have been attracted to locate head offices in that nation as
a result of its very low corporate tax regime
Trade balance is defined as the value of exports minus value of imports: 𝑇𝐵𝑡 ≡ 𝐸𝑋𝑡 − 𝐼𝑀𝑡
Current account is defined as the sum of the trade balance and the net investment income: 𝐶𝐴𝑡 = 𝑇𝐵𝑡 + 𝑟𝑡 𝐵𝑡
- 𝐶𝐴 > 0: surplus → the country is lending abroad (accumulating foreign credit)
- 𝐶𝐴 < 0: deficit → the country is borrowing from abroad (accumulating foreign debt)
- A country’s CA balance equals the change in its net foreign wealth
Basic Concepts: Net International Investment Position
- Net international investment position: 𝐵𝑡 = 𝐴𝑡 − 𝐿𝑡
o 𝐴𝑡 = value of gross asset position and 𝐿𝑡 = value of gross liabilities position
- Since 1990s, there has been a dramatic increase in international asset trade in developed and many
developing countries
- The main evidence is provided in a series of papers by Lane and Milesi-Ferretti (“The External Wealth of
Nations Mark II: Revised and Extended Estimates of Foreign Assets and Liabilities, 1970–2004”) who have
collected data on the levels of gross assets and liabilities
, - Measure of international asset trade (volume based measure):
𝐴+𝐿
𝐺𝐷𝑃
o 𝐴 = assets and 𝐿 = liabilities
- Looking at this measure for selected countries, we see a boom
in the UK and Switzerland, growing to around 6 times its GDP
- For other countries, the increase is still significant, but much
less than that of the UK and Switzerland
- This increase in gross position is crucial for understanding the
adjustment of the CA
Basic Concepts: Valuation Effects
- Valuation effects: CA deficits is not the only factor in the dynamic of net foreign asset positions 𝐵
- Value of assets and liabilities change due to changes in the value of assets (stock markets movements, ER
changes) → valuation channel increasing in importance, in line with scale of financial globalization
- Valuation effects absent from traditional theory and also from official statistics → BoP reports CA only at
historical cost (potentially misleading reflection of the change in the country’s net foreign asset position)
Imbalances and valuation effect
- This plots the evolution of the net international investment position (i.e. 𝐵) for the US from 1980 to 2008
- We can see that there has been a constant decline in 𝐵
- In the early 2000s, we see two lines:
o The dashed line corresponds to the fact that the US is
in a constant CA deficit, accumulating more and
more debt → it is the projected evolution of the net
external position due to the CA deficit
o In reality though, we see from the blue line that it did
not worsen (pre-Crisis) even though the economy
continued running a CA deficit → this is due to
valuation effects from ER fluctuations (in particular,
the US dollar depreciated in this period)
Basic Concepts: Saving and the Current Account
- National saving: portion of final goods not devoted to consumption or government purchases
- Closed economy: 𝑆 = 𝑌 − 𝐶 − 𝐺 = 𝐼
- Open economy (now thinking in terms of GNP): 𝑆 = 𝑌 − 𝐶 − 𝐺 = 𝐼 + 𝐶𝐴
o Increase in savings does not need to be matched by corresponding increase in investment
o Current account surplus is referred to as net foreign investment because a country’s savings can be
borrowed by a second country
, Basic Concepts: Sectoral Accounting
- Decomposition of savings:
o Private saving: 𝑆 𝑝 = 𝑌 − 𝑇 − 𝐶
o Government saving: 𝑆 𝑔 = 𝑇 − 𝐺
- National savings: 𝑆 = 𝑆 𝑔 + 𝑆 𝑝 = 𝑌 − 𝐶 − 𝐺
- National income accounting identity in terms of sectoral balances:
𝐶𝐴
⏟ =⏟ (𝑆 𝑝 − 𝐼) − ⏟
(𝐺 − 𝑇)
𝐸𝑥𝑡𝑒𝑟𝑛𝑎𝑙 𝑃𝑟𝑖𝑣𝑎𝑡𝑒 𝑃𝑢𝑏𝑙𝑖𝑐
o 𝑆 = 𝐼 + 𝐶𝐴 (from previous section)
o 𝑌 − 𝐶 − 𝐺 = 𝐼 + 𝐶𝐴 (subbing in 𝑆 = 𝑌 − 𝐶 − 𝐺)
o 𝐶𝐴 = 𝑌 − 𝐶 − 𝐺 − 𝐼 (rearrange to make 𝐶𝐴 the subject)
o 𝐶𝐴 = 𝑌 − 𝐶 − 𝐺 − 𝐼 + 𝑇 − 𝑇 (add and subtract 𝑇)
o 𝐶𝐴 = (𝑌 − 𝑇 − 𝐶 − 𝐼) + (𝑇 − 𝐺) (group terms)
o 𝐶𝐴 = (𝑆 𝑝 − 𝐼) − (𝐺 − 𝑇) (subbing in 𝑆 𝑝 = 𝑌 − 𝑇 − 𝐶; 𝑇 − 𝐺 = −(𝐺 − 𝑇))
Imbalances are associated with changes in financial wealth
- Example 1:
o Assume that the external or foreign balance equals zero
o Assume that the private domestic sector’s income is $100 billion while its spending is equal to $90
billion, which delivers an overall surplus of $10 billion over the year
o Then, from the identity, the government sector’s fiscal deficit for the year is equal to $10 billion
o This implies that the private domestic sector will accumulate $10 billion of net financial wealth
during the year, consisting of $10 billion of domestic government sector liabilities (given that the
external balance is zero)
- Example 2:
o Assume current account deficit of $20 billion
o At the same time, assume the government sector spends less than its income, running a fiscal
surplus of $10 billion
o From our accounting identity, we know that over the same period, the private domestic sector must
have run an overall deficit equal to $30 billion ($20 billion plus $10 billion)
o This implies that at the same time, its net financial wealth will have fallen by $30 billion because it
sold assets and/or issued debt
o Meanwhile, the government sector will have increased its net financial wealth by $10 billion
(reducing its outstanding debt or increasing its claims on the other sectors), and the foreign sector
will have increased its net financial position by $20 billion (also reducing its outstanding debt or
increasing its claims on the nation’s residents or government)
Basic Concepts: Budget Deficits and Current Account Deficits
Do government budget deficits worsen the CA?
- Large imbalances in the CA of the US in the 1980s
- Some policymakers identified the origin of the CA imbalance on a growing government deficit (Reagan
administration)
- Effects of higher government deficit were initially hidden by the fall of investment at the beginning of the
80s (US economy in recession following the Volcker disinflation) → but when investment came back to
normal, we observed both budget and CA deficit (the so-called “twin deficit”)
Introduction
- International macroeconomics is the study of interdependent economies focusing on key economic wide
variables of interests:
o Current account
o Nominal exchange rate
o Interest rates
o Income
- Two key dimensions of analysis:
o Trade integration
o Financial markets integration
Recent Questions/Policy Issues
- Recent debates:
o Global imbalances; (pre-global financial crisis)
o Imbalances within the Euro area
o Crises in emerging market economies (sudden stops)
o Spillovers and policies in a world in a liquidity trap
- Questions that we address:
o Why countries run current account surplus/deficits? How do we assess sustainability?
o How are ERs determined?
o Why do rich countries have higher prices?
o What are the factors that determine currency crises?
o What is a liquidity trap and what are its consequences?
The Global Imbalance Debate
- Debate focusing on the current account of the US (red line)
- We see that it has deteriorated in the second part of the 90s,
becoming more and more in deficit, eventually reaching −6%
of GDP just before the global financial crisis
- In the years preceding this, there was a lot of debate about
whether these deficits were sustainable and if there was a
need to correct it and how this correction would occur
- The blue line looks at East Asian countries (in particular China’s
current account), and we see it is a mirror image of the big
deficits in the US, with significant surpluses, reaching almost
10% of GDP
- The green line looks at Germany, and we see in the years preceding the introduction of the Euro, it was
negative and since then it has become more and more of a surplus, reaching a peak of over 8%
How to interpret imbalances?
1. Traditional view: correction in imbalance with relative price (ER) adjustment (Obstfeld and Rogoff 2005,
2006)
2. Alternative perspective: imbalance as equilibrium outcome
a. Saving glut (Bernanke, 2005) → US had a deficit because the rest of the world was saving
b. Bretton Woods 2 → structure of the international monetary system resembles the old Bretton
Woods (hence Bretton Woods 2)
c. Financial integration (Caballero, Fahri and Gourinchas, 2008) → financial integration between
countries that are at different stages of development, so because US is more developed, the flow of
capital goes towards US
,Net Foreign Assets Evolution (selected countries)
- The net foreign asset position is a measure of the external net credit
position to the rest of the world
- The evolution of the net foreign asset positions of selected countries
shows there are big changes over time
- For example, Ireland (maroon) goes from a surplus of around 50% of
GDP just before the introduction of the Euro to a deficit of almost
100% of GDP in 2010
- Germany (black dashed line) has been accumulating net credit over
time
Basic Concepts: National Income Accounting
GNP: value of goods and services produced by the factors of production of a country in a given time period
Open economy (all output in goods and services is consumed or invested by domestic citizens or purchased by the
government): 𝑌 = 𝐶 + 𝐼 + 𝐺 + 𝐸𝑋 − 𝐼𝑀
- Expenditure view: classification depends on who bought the goods and services
o 𝐶 – consumption: amount consumed by private domestic residents
o 𝐼 – investment: amount used by private firms to build new plants and equipment (or output used by
firms to produce future output)
o 𝐺 – government consumption: amount consumed by the government
- Foreign trade:
o 𝐸𝑋 – value of exports: goods and services sold abroad
o 𝐼𝑀 – value of imports: goods and services purchased from abroad
Another measure is the GDP: value of goods and services produced within a country’s borders
- GNP = GDP + income from foreign assets (or from loans to foreigners)
- 𝑌𝑡𝐺𝑁𝑃 = 𝑌𝑡𝐺𝐷𝑃 + 𝑟𝑡 𝐵𝑡 where 𝐵 denotes the economy’s net stock of foreign assets (or loans to foreigners)
and 𝑟 is the return on foreign assets (for now think of it as an interest rate)
- Example: the income from a British owned asset (e.g. factory) located in America is not included in UK GDP,
only in UK GNP → this income is actually included in US GDP
- Ireland is an example of a country in which there is a significant gap between GNP and GDP due to the
presence of many large foreign-owned firms that have been attracted to locate head offices in that nation as
a result of its very low corporate tax regime
Trade balance is defined as the value of exports minus value of imports: 𝑇𝐵𝑡 ≡ 𝐸𝑋𝑡 − 𝐼𝑀𝑡
Current account is defined as the sum of the trade balance and the net investment income: 𝐶𝐴𝑡 = 𝑇𝐵𝑡 + 𝑟𝑡 𝐵𝑡
- 𝐶𝐴 > 0: surplus → the country is lending abroad (accumulating foreign credit)
- 𝐶𝐴 < 0: deficit → the country is borrowing from abroad (accumulating foreign debt)
- A country’s CA balance equals the change in its net foreign wealth
Basic Concepts: Net International Investment Position
- Net international investment position: 𝐵𝑡 = 𝐴𝑡 − 𝐿𝑡
o 𝐴𝑡 = value of gross asset position and 𝐿𝑡 = value of gross liabilities position
- Since 1990s, there has been a dramatic increase in international asset trade in developed and many
developing countries
- The main evidence is provided in a series of papers by Lane and Milesi-Ferretti (“The External Wealth of
Nations Mark II: Revised and Extended Estimates of Foreign Assets and Liabilities, 1970–2004”) who have
collected data on the levels of gross assets and liabilities
, - Measure of international asset trade (volume based measure):
𝐴+𝐿
𝐺𝐷𝑃
o 𝐴 = assets and 𝐿 = liabilities
- Looking at this measure for selected countries, we see a boom
in the UK and Switzerland, growing to around 6 times its GDP
- For other countries, the increase is still significant, but much
less than that of the UK and Switzerland
- This increase in gross position is crucial for understanding the
adjustment of the CA
Basic Concepts: Valuation Effects
- Valuation effects: CA deficits is not the only factor in the dynamic of net foreign asset positions 𝐵
- Value of assets and liabilities change due to changes in the value of assets (stock markets movements, ER
changes) → valuation channel increasing in importance, in line with scale of financial globalization
- Valuation effects absent from traditional theory and also from official statistics → BoP reports CA only at
historical cost (potentially misleading reflection of the change in the country’s net foreign asset position)
Imbalances and valuation effect
- This plots the evolution of the net international investment position (i.e. 𝐵) for the US from 1980 to 2008
- We can see that there has been a constant decline in 𝐵
- In the early 2000s, we see two lines:
o The dashed line corresponds to the fact that the US is
in a constant CA deficit, accumulating more and
more debt → it is the projected evolution of the net
external position due to the CA deficit
o In reality though, we see from the blue line that it did
not worsen (pre-Crisis) even though the economy
continued running a CA deficit → this is due to
valuation effects from ER fluctuations (in particular,
the US dollar depreciated in this period)
Basic Concepts: Saving and the Current Account
- National saving: portion of final goods not devoted to consumption or government purchases
- Closed economy: 𝑆 = 𝑌 − 𝐶 − 𝐺 = 𝐼
- Open economy (now thinking in terms of GNP): 𝑆 = 𝑌 − 𝐶 − 𝐺 = 𝐼 + 𝐶𝐴
o Increase in savings does not need to be matched by corresponding increase in investment
o Current account surplus is referred to as net foreign investment because a country’s savings can be
borrowed by a second country
, Basic Concepts: Sectoral Accounting
- Decomposition of savings:
o Private saving: 𝑆 𝑝 = 𝑌 − 𝑇 − 𝐶
o Government saving: 𝑆 𝑔 = 𝑇 − 𝐺
- National savings: 𝑆 = 𝑆 𝑔 + 𝑆 𝑝 = 𝑌 − 𝐶 − 𝐺
- National income accounting identity in terms of sectoral balances:
𝐶𝐴
⏟ =⏟ (𝑆 𝑝 − 𝐼) − ⏟
(𝐺 − 𝑇)
𝐸𝑥𝑡𝑒𝑟𝑛𝑎𝑙 𝑃𝑟𝑖𝑣𝑎𝑡𝑒 𝑃𝑢𝑏𝑙𝑖𝑐
o 𝑆 = 𝐼 + 𝐶𝐴 (from previous section)
o 𝑌 − 𝐶 − 𝐺 = 𝐼 + 𝐶𝐴 (subbing in 𝑆 = 𝑌 − 𝐶 − 𝐺)
o 𝐶𝐴 = 𝑌 − 𝐶 − 𝐺 − 𝐼 (rearrange to make 𝐶𝐴 the subject)
o 𝐶𝐴 = 𝑌 − 𝐶 − 𝐺 − 𝐼 + 𝑇 − 𝑇 (add and subtract 𝑇)
o 𝐶𝐴 = (𝑌 − 𝑇 − 𝐶 − 𝐼) + (𝑇 − 𝐺) (group terms)
o 𝐶𝐴 = (𝑆 𝑝 − 𝐼) − (𝐺 − 𝑇) (subbing in 𝑆 𝑝 = 𝑌 − 𝑇 − 𝐶; 𝑇 − 𝐺 = −(𝐺 − 𝑇))
Imbalances are associated with changes in financial wealth
- Example 1:
o Assume that the external or foreign balance equals zero
o Assume that the private domestic sector’s income is $100 billion while its spending is equal to $90
billion, which delivers an overall surplus of $10 billion over the year
o Then, from the identity, the government sector’s fiscal deficit for the year is equal to $10 billion
o This implies that the private domestic sector will accumulate $10 billion of net financial wealth
during the year, consisting of $10 billion of domestic government sector liabilities (given that the
external balance is zero)
- Example 2:
o Assume current account deficit of $20 billion
o At the same time, assume the government sector spends less than its income, running a fiscal
surplus of $10 billion
o From our accounting identity, we know that over the same period, the private domestic sector must
have run an overall deficit equal to $30 billion ($20 billion plus $10 billion)
o This implies that at the same time, its net financial wealth will have fallen by $30 billion because it
sold assets and/or issued debt
o Meanwhile, the government sector will have increased its net financial wealth by $10 billion
(reducing its outstanding debt or increasing its claims on the other sectors), and the foreign sector
will have increased its net financial position by $20 billion (also reducing its outstanding debt or
increasing its claims on the nation’s residents or government)
Basic Concepts: Budget Deficits and Current Account Deficits
Do government budget deficits worsen the CA?
- Large imbalances in the CA of the US in the 1980s
- Some policymakers identified the origin of the CA imbalance on a growing government deficit (Reagan
administration)
- Effects of higher government deficit were initially hidden by the fall of investment at the beginning of the
80s (US economy in recession following the Volcker disinflation) → but when investment came back to
normal, we observed both budget and CA deficit (the so-called “twin deficit”)