Tutorial questions (week 2)
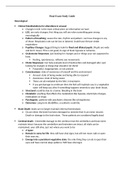
3.1 Last column of the above Summary statistics table, gives the kurtosis values of the
different variables introduced in the table. What does the kurtosis measure tell us? What can
you conclude looking at the values provided in the table (give name of variables)? (6.5
points)
i.The kurtosis values tell us:
1. The shape of the distribution
2. Deviation from the normal
3. Degree to which the score clusters at the tail
ii.What can you conclude looking at the values provided in the
table?
1. The majority of variables are leptokurtic, thus the tails weigh
heavier, and can result in a pointier distribution (Kurtosis > 3)
2. The Variable “experience” is platykurtic, thus the tails weigh
less, and can result in a flatter distribution (kurtosis < 3)
3. The variable “Sales” has a very high kurtosis score, which
means that the chance of an extreme outlier is very low.
4. The variable “ROE” has a kurtosis score of 3.01, which implies
the distribution is very close to normal. (slightly leptokurtic)
, 3.2 The Column 6 of the above Table provides the skewness values of the different
variables. What does the skewness measure tell us? What can you say about skewness of
variable ‘wage’? (3.5 points)
iii. The skewness tell us :
1. The shape of the distribution
2. Deviation from normal
3. Symmetry
4. Whether the tail extends to the right or left (positively skewed or
negatively skewed)
5. Whether to use median or mean for measure of central
tendency
iv. Skewness of variable wage:
1. It is positively skewed with a skewness of 2.01
2. It is substantially skewed to the right based on the score being
higher than one
3. We should use median for measure of central tendency
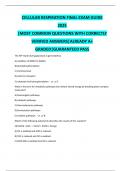