Protein crystallography part 2
Overview
1. Introduction
2. The PDB file
3. Data/ parameter
4. Model building
5. Model refinement
6. Validation
Reminder: reflection vs map
A crystallographic experiment provides:
- Uninterpretable data
- List of reflections and their intensity
After some extra effort, the initial, approximate phases φ(hkl) of the structure factors F (hkl).
By a fourier transformation, this result in something ‘more imaginable’, the electron density map
ρ(x, y, z):
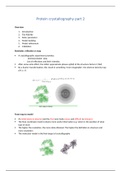
From map to model
An initial electron density (and the final one) looks messy and difficult to interpret.
The final coordinate model contains more useful information e.g. where is the position of what
type of atom
The higher the resolution, the more data obtained. The higher the definition in structure and
more resolution
The molecular model is the final target of crystallography
, Storing structural data: the PDB file
Protein models are stored in a protein data bank, PDB
The PDB do not represent insignificant experimental data
From the experiment we get diffraction intensity and after some work we get the electron
density ρ within the unit cell
The model is the best match from the authors point of view that explains the experimental data
What can expect in a PDB file
A typical PDB file contain a header with supplemental information (author, compound,
publication etc), the crystallographic space group and unit cell dimension.
The main part of the file is atom entries, one per line
An atom entry contains:
- Atom type
- Atom name
- Residue type it belongs to
- Coordinates
- Occupancy
- B-factor
Occupancy and B-factor of an atom
Occupancy B-factor
A typical crystal contains a large number of The B-factor tells us how well the structure
unit cells, and, therefore the resulting is defined
model is only an average of all these cells If B-factor is moderate= well defined
Some atoms especially those of large side If B-factor is too high = difficult to make a
chains (arginine and phenylalanine) can be comment
partially disordered others can have several Even though data is collected at 100K,
but fixed orientation atoms are not immobile but vibrate –
An occupancy lower than 1 indicates that thermal motion
an atom occupies this position in only a The temperature or B-factor describes the
fraction of all unit cells. vibration as a sphere within which the
Most atoms have an occupancy of 1 atoms oscillates
Some authors put the occupancy as 0 For high resolution, when enough data is
available, the vibration in each of the 3
directions can be described separately.
The B-factor splits up into a symmetrical
3x3 matrix that describes anisotropic
Overview
1. Introduction
2. The PDB file
3. Data/ parameter
4. Model building
5. Model refinement
6. Validation
Reminder: reflection vs map
A crystallographic experiment provides:
- Uninterpretable data
- List of reflections and their intensity
After some extra effort, the initial, approximate phases φ(hkl) of the structure factors F (hkl).
By a fourier transformation, this result in something ‘more imaginable’, the electron density map
ρ(x, y, z):
From map to model
An initial electron density (and the final one) looks messy and difficult to interpret.
The final coordinate model contains more useful information e.g. where is the position of what
type of atom
The higher the resolution, the more data obtained. The higher the definition in structure and
more resolution
The molecular model is the final target of crystallography
, Storing structural data: the PDB file
Protein models are stored in a protein data bank, PDB
The PDB do not represent insignificant experimental data
From the experiment we get diffraction intensity and after some work we get the electron
density ρ within the unit cell
The model is the best match from the authors point of view that explains the experimental data
What can expect in a PDB file
A typical PDB file contain a header with supplemental information (author, compound,
publication etc), the crystallographic space group and unit cell dimension.
The main part of the file is atom entries, one per line
An atom entry contains:
- Atom type
- Atom name
- Residue type it belongs to
- Coordinates
- Occupancy
- B-factor
Occupancy and B-factor of an atom
Occupancy B-factor
A typical crystal contains a large number of The B-factor tells us how well the structure
unit cells, and, therefore the resulting is defined
model is only an average of all these cells If B-factor is moderate= well defined
Some atoms especially those of large side If B-factor is too high = difficult to make a
chains (arginine and phenylalanine) can be comment
partially disordered others can have several Even though data is collected at 100K,
but fixed orientation atoms are not immobile but vibrate –
An occupancy lower than 1 indicates that thermal motion
an atom occupies this position in only a The temperature or B-factor describes the
fraction of all unit cells. vibration as a sphere within which the
Most atoms have an occupancy of 1 atoms oscillates
Some authors put the occupancy as 0 For high resolution, when enough data is
available, the vibration in each of the 3
directions can be described separately.
The B-factor splits up into a symmetrical
3x3 matrix that describes anisotropic