

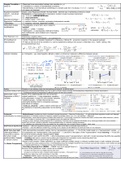
Sample Correlation r • Measures linear association between two variables (x1, y1)
cor($, $) • Correlation is a version of standardised covariance
• Standardising: a rule that will put something on a certain scale (for r it’s always -1 ≤ r ≤ 1 → special case
r=0 means not detected)
Equations (expected Simple Linear Regression Model / Normal Model - General way of predicting continuous values
value E… but actual Parameters of a Normal Model (2 parameters: location (mean) & spread (variance)):
value is Y) • β0: ‘Y if x is 0’ intercept parameter
• β1: slope parameter
Intercept and Slope / • ϵi: random ‘noise’ / ‘error’ term
Regression Coefficients • xi: predictor, feature, covariate, explanatory/independent variable
/ Parameters • Yi: response, outcome, dependent variable
Fitting SLR models • Theoretically ϵi is error term, but in model it’s
(optimization) ‘residual’
ϵi {hat}= yi − y{hat}i → residual
• Optimization → Least squares (method for finding
best coefficients) | want smallest sum of squared
residuals
Fitted Regression Line lm(response ~ predictor, data=)
geom_smooth(method=lm, se=FALSE) → se is standard error
R2 (Coefficient of • It’s the “Proportion of Variation Explained” is a Measure of Model Fit - proportion reduction in the squared residuals
Determination) • R2 tells us how much of the variation in y can be explained by taking x into account | (Var(mean of y) - Var(fit - taking x into
account))/Var(mean of y)
Indicator Variables ex. lm(heights ~ sex, data=heights) | β{hat} is called a contrast as it captures a difference between groups
Scaling Choosing x is an arbitrary choice (can be anything and output & r is still the same)
Hypothesis Testing in SLR (depends on Normal Model=TRUE) H0:β1=0 | HA:β1≠0 | ɑ=0.05 | entails normality, homoscedasticity, independence, linearity assumptions
→ Confidence Intervals on Regression Coefficient values are then also possible
Multivariate Linear Review: Rˆ2 (mathematically can’t do worse than
Regression vs SLR (1 original predictor so → more explanatory variables =
variable) more parameters = larger R2) and Indicator Variables,
• baseline groups→ number that serves as a
reasonable starting point for comparison purposes
(see effects of change)
• rowid_to_column() → adds a column at the start of
the dataframe of ascending sequential row ids starting
at 1
Confounds, • Multicollinearity (variables are highly correlated amongst themselves) = Observed Confounding → A multivariate linear regression model can’t detangle
multicollinearity & p-values contributions of correlated (positive or negative) variables (correlation matrix). eg. x1 & x2 are identical→ difference?
Multicollinearity: observable association prohibits effect attribution | Confounding: unobserved variable association would prohibit effect attribution (-ethics)
• Doesn’t matter for prediction (ML) | Lose statistical power with statistical inference
• stronger p-value, stronger evidence against NULL hypothesis. Outcomes can be explained individually, but p-values get weaker with more variables →
model can't tell which variable to attribute cause/explanation/effect to, statistical strength decreases
• Two variables are confounded if they can explain the 3rd variable (eg. sex in length of shoe vs height) - facet_wrap
Stat/Practical Significance • Statistical → effect (for hypothesis testing you can just collect more data to eventually reject the NULL)
• Practical → does the difference matter? Eg. zooming out of 2 slopes and the difference is small (can make it 1 line instead?)
80/20 Train-Test Split • Split representative population sample into two representative samples → 1. You fit the model based on a "representative" sample → 2
(Alternative Method → So subsamples are "representative of the population" → 3 Use 80% of the data to fit the "representative" model (training) → 4 Use 20%
not just R2) is used to to see if the model’s actually "representative" (test)
find which model • If data doesn’t work well for the 20% → either subsamples weren’t representative to start with | model memorised the 80% (too specific)
performs better. Subject • Overfitting data means a random chance pattern gets interpreted as a real pattern (overly memorising data it has)
to “random chance” • Underfitting model’s not good enough yet (predictions could be improved)
• Model is less complex = better estimation. eg. slope coefficient variable (worst) vs indicator variable (best) vs both variables (2nd best)
For Model Comparison • There was not p-value evidence at the α = 0.05 significance level for lm(height~shoePrint+sex), but there was train-test evidence. & all models have good
out of sample performance (• In Sample Scoring / Out of Sample Scoring).
• Root Mean Squared Error (RMSE) → RMSE: how much spread there is in
the error of the predictions. small = errors not so variable.
• normal for the test error to be higher than the train error
• is based on scoring how well a created model explains new data → How good it is at
predicting new data | How well it generalises to new data
• Prediction (RMSE) doesn’t care about confounding or multicollinearity
• Randomness → when there’s enough data so the random train-test split isn’t just "lucky"
cor($, $) • Correlation is a version of standardised covariance
• Standardising: a rule that will put something on a certain scale (for r it’s always -1 ≤ r ≤ 1 → special case
r=0 means not detected)
Equations (expected Simple Linear Regression Model / Normal Model - General way of predicting continuous values
value E… but actual Parameters of a Normal Model (2 parameters: location (mean) & spread (variance)):
value is Y) • β0: ‘Y if x is 0’ intercept parameter
• β1: slope parameter
Intercept and Slope / • ϵi: random ‘noise’ / ‘error’ term
Regression Coefficients • xi: predictor, feature, covariate, explanatory/independent variable
/ Parameters • Yi: response, outcome, dependent variable
Fitting SLR models • Theoretically ϵi is error term, but in model it’s
(optimization) ‘residual’
ϵi {hat}= yi − y{hat}i → residual
• Optimization → Least squares (method for finding
best coefficients) | want smallest sum of squared
residuals
Fitted Regression Line lm(response ~ predictor, data=)
geom_smooth(method=lm, se=FALSE) → se is standard error
R2 (Coefficient of • It’s the “Proportion of Variation Explained” is a Measure of Model Fit - proportion reduction in the squared residuals
Determination) • R2 tells us how much of the variation in y can be explained by taking x into account | (Var(mean of y) - Var(fit - taking x into
account))/Var(mean of y)
Indicator Variables ex. lm(heights ~ sex, data=heights) | β{hat} is called a contrast as it captures a difference between groups
Scaling Choosing x is an arbitrary choice (can be anything and output & r is still the same)
Hypothesis Testing in SLR (depends on Normal Model=TRUE) H0:β1=0 | HA:β1≠0 | ɑ=0.05 | entails normality, homoscedasticity, independence, linearity assumptions
→ Confidence Intervals on Regression Coefficient values are then also possible
Multivariate Linear Review: Rˆ2 (mathematically can’t do worse than
Regression vs SLR (1 original predictor so → more explanatory variables =
variable) more parameters = larger R2) and Indicator Variables,
• baseline groups→ number that serves as a
reasonable starting point for comparison purposes
(see effects of change)
• rowid_to_column() → adds a column at the start of
the dataframe of ascending sequential row ids starting
at 1
Confounds, • Multicollinearity (variables are highly correlated amongst themselves) = Observed Confounding → A multivariate linear regression model can’t detangle
multicollinearity & p-values contributions of correlated (positive or negative) variables (correlation matrix). eg. x1 & x2 are identical→ difference?
Multicollinearity: observable association prohibits effect attribution | Confounding: unobserved variable association would prohibit effect attribution (-ethics)
• Doesn’t matter for prediction (ML) | Lose statistical power with statistical inference
• stronger p-value, stronger evidence against NULL hypothesis. Outcomes can be explained individually, but p-values get weaker with more variables →
model can't tell which variable to attribute cause/explanation/effect to, statistical strength decreases
• Two variables are confounded if they can explain the 3rd variable (eg. sex in length of shoe vs height) - facet_wrap
Stat/Practical Significance • Statistical → effect (for hypothesis testing you can just collect more data to eventually reject the NULL)
• Practical → does the difference matter? Eg. zooming out of 2 slopes and the difference is small (can make it 1 line instead?)
80/20 Train-Test Split • Split representative population sample into two representative samples → 1. You fit the model based on a "representative" sample → 2
(Alternative Method → So subsamples are "representative of the population" → 3 Use 80% of the data to fit the "representative" model (training) → 4 Use 20%
not just R2) is used to to see if the model’s actually "representative" (test)
find which model • If data doesn’t work well for the 20% → either subsamples weren’t representative to start with | model memorised the 80% (too specific)
performs better. Subject • Overfitting data means a random chance pattern gets interpreted as a real pattern (overly memorising data it has)
to “random chance” • Underfitting model’s not good enough yet (predictions could be improved)
• Model is less complex = better estimation. eg. slope coefficient variable (worst) vs indicator variable (best) vs both variables (2nd best)
For Model Comparison • There was not p-value evidence at the α = 0.05 significance level for lm(height~shoePrint+sex), but there was train-test evidence. & all models have good
out of sample performance (• In Sample Scoring / Out of Sample Scoring).
• Root Mean Squared Error (RMSE) → RMSE: how much spread there is in
the error of the predictions. small = errors not so variable.
• normal for the test error to be higher than the train error
• is based on scoring how well a created model explains new data → How good it is at
predicting new data | How well it generalises to new data
• Prediction (RMSE) doesn’t care about confounding or multicollinearity
• Randomness → when there’s enough data so the random train-test split isn’t just "lucky"


